
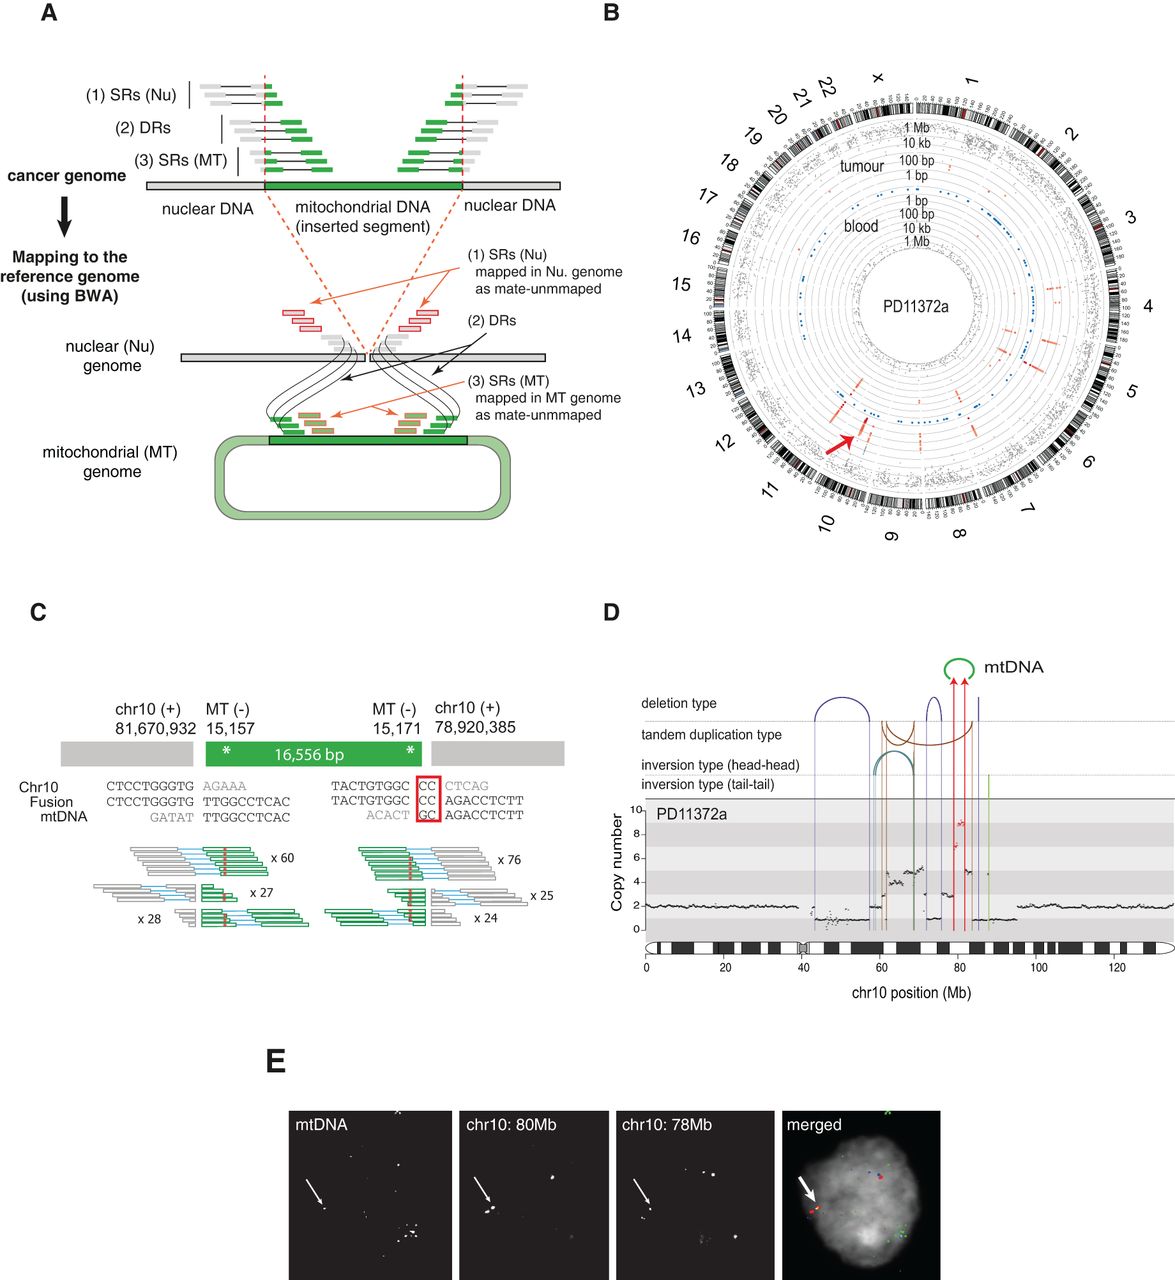
Discovery of somatic nuclear mtDNA transfer from PD11372a. (A) The strategy for detection of nuclear mtDNA transfer events. See Methods for a detailed description. (SRs) Split-reads, (DRs) discordant reads, (Nu) nucleus, (MT) mitochondria. (B) Graphical representation of discordant read clusters in PD11372a and its paired-normal tissue (PD11372b). The red arrow indicates tumor-specific discordant-read clusters in Chr 10. Chromosome ideograms are shown in the outer layer. The distance between each discordant read and one prior to it (the inter-read distance) is plotted on the vertical axis on a log-scale in the middle (tumor) and inner layer (blood). Blue dots shown in the middle layer represent known numts. (C) mtDNA integration in PD11372a. Breakpoint sequences are shown. Red rectangle highlights microhomology. Numbers of discordant split reads are presented. Inherited mtDNA substitution polymorphisms are shown by red asterisks. (D) Rearrangement architectures of Chromosome 10 of PD11372a. DNA copy numbers are shown by black dots. The copy number for 2.75-Mb-long region fused with mtDNA is colored in red. Reads supporting rearrangements (large deletions, tandem duplications, tail-tail and head-head inversions) are shown by arcs and vertical lines. Chr 10-mtDNA fusions are shown with red arrows. (E) Nuclear FISH confirms the mitochondrial-nuclear DNA fusion in the nucleus. (Red) Chr 10 (80 Mb), (blue) Chr 10 (78 Mb), and (green) mtDNA.


