
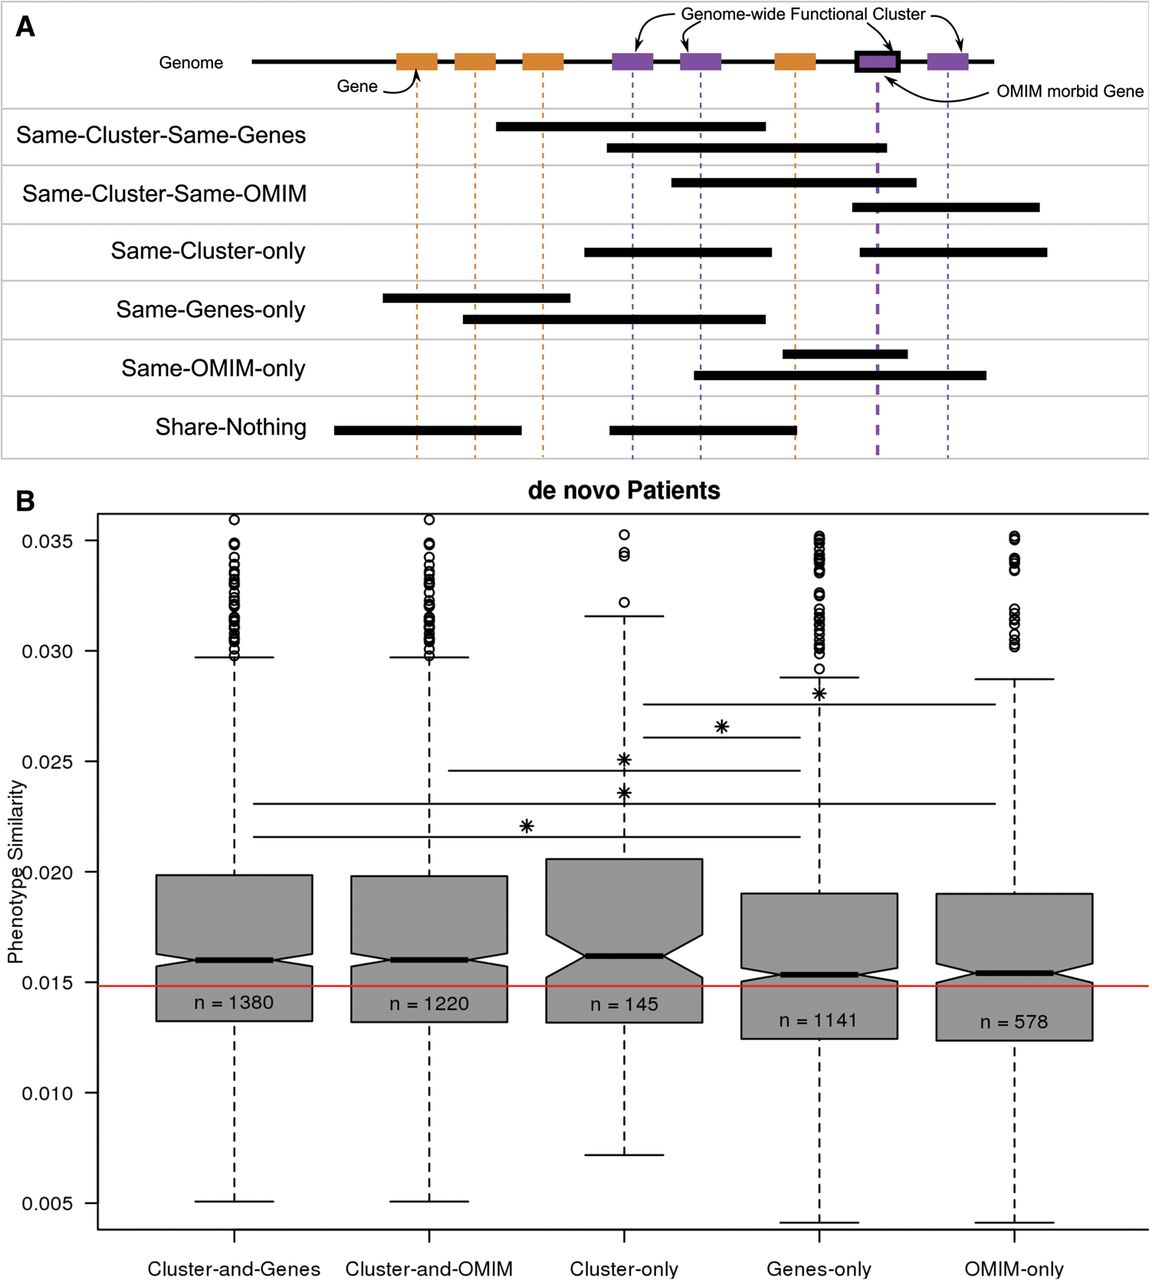
Clusters of functionally related genes are a better indicator of phenotypic similarity than genes. (A) Patient pairs were placed into six categories based on shared genetic elements. Orange rectangles represent genes. Purple rectangles represent genes belonging to the same genome-wide functional cluster. Black bordered rectangles indicate OMIM disease genes. Black segments indicate the de novo CNVs from two different patients. Only one CNV per patient is included for each situation for simplicity; in cases with multiple de novo CNVs, overlaps between all the CNV(s) of one patient and all the CNVs of the other patient were considered. (B) Phenotype similarity as measured by the Goodall3 index (Boriah et al. 2008) between pairs of patients in each category shown in A: Cluster-and-Genes affect the functional cluster and the same genes; Cluster-and-OMIM affect the same functional cluster and the same OMIM genes; Cluster-only affect the same functional cluster but different genes; Genes-only affect the same genes but not the functional cluster; OMIM-only affect the same OMIM genes but not the same functional cluster. Stars indicate significance, calculated using a Wilcoxon rank-sum test: (*) P < 0.05; (**) P < 0.005; (***) P < 0.0005, etc., up to a maximum of five stars. The red line indicates the median phenotypic similarity over all patient pairs.


