
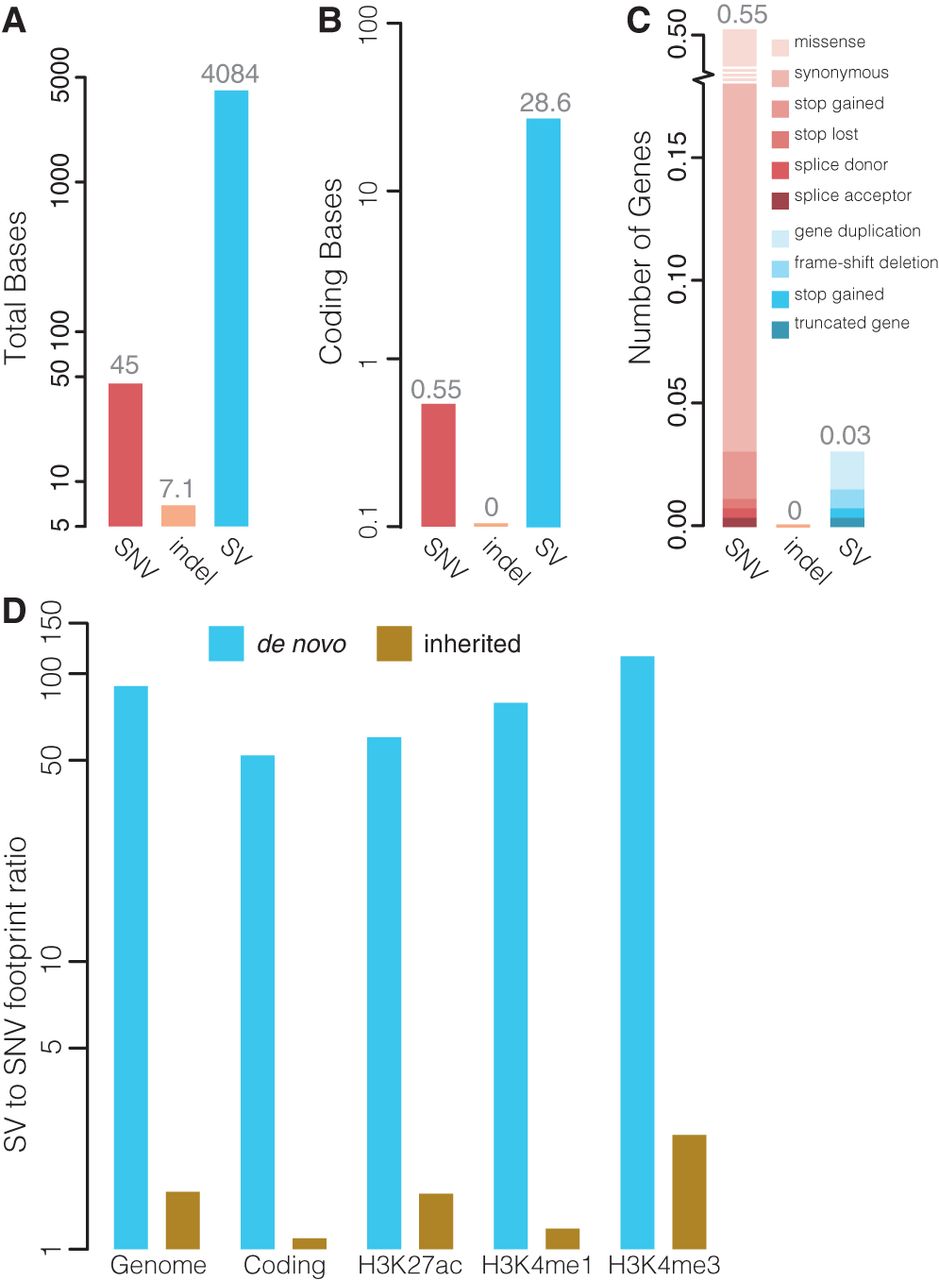
Functional impact of de novo indels and SVs. (A) Average number of genomic bases affected by de novo SNVs, indels, and SVs per child. (B) Average number of coding bases affected by de novo SNVs, indels, and SVs per child. (C) Average number of genes affected by de novo SNVs, indels, and SVs per child. The relative frequencies of the effects of the variations on the gene are indicated. (D) Comparison of the footprint of de novo (blue bars) and inherited (brown bars) large SVs (>20 bp) relative to the footprint of SNVs. The footprint was computed genome-wide, in protein-coding regions and genomic regions marked by H3K4me1, H3K4me3, and H3K27ac based on data from the ENCODE Project (The ENCODE Project Consortium 2007). The y-axis shows the ratio of the average number of affected bases per offspring relative to SNVs.


