
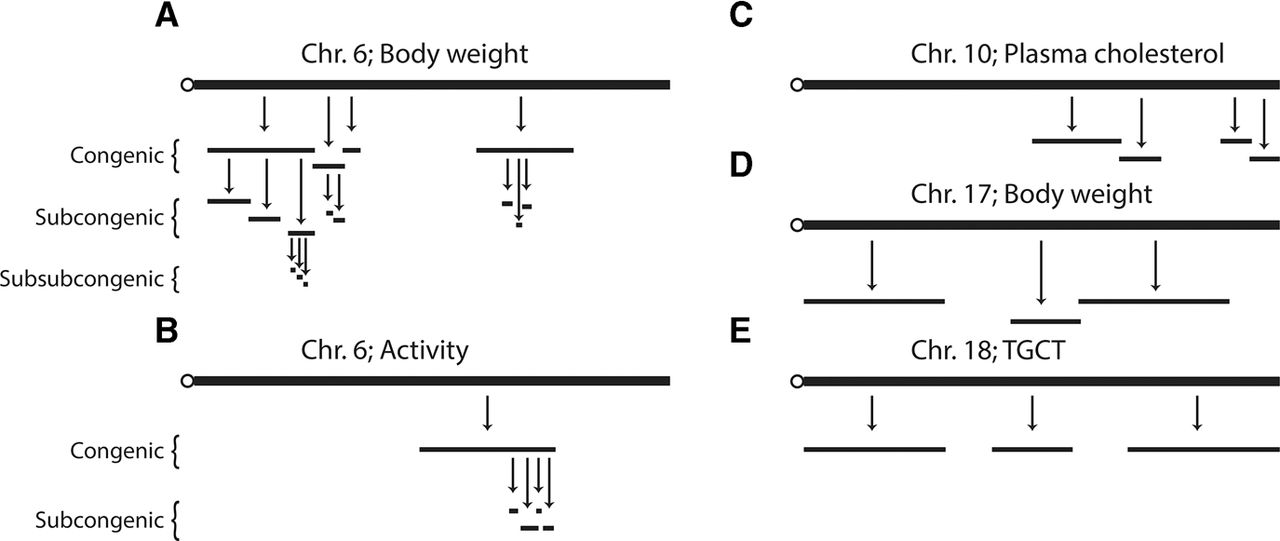
Figure 2.
QTL intervals frequently contain multiple sub-QTLs. High-resolution mapping of QTL intervals with CSS, congenic, subcongenic, and subsub-congenic strains identified multiple sub-QTLs within QTLs at each level of genetic resolution. QTLs and sub-QTLs were mapped for body weight (A), activity (B), plasma cholesterol (C), body weight (D), and testicular germ cell tumors (TGCT) (E). QTL intervals are represented by horizontal black lines.


