
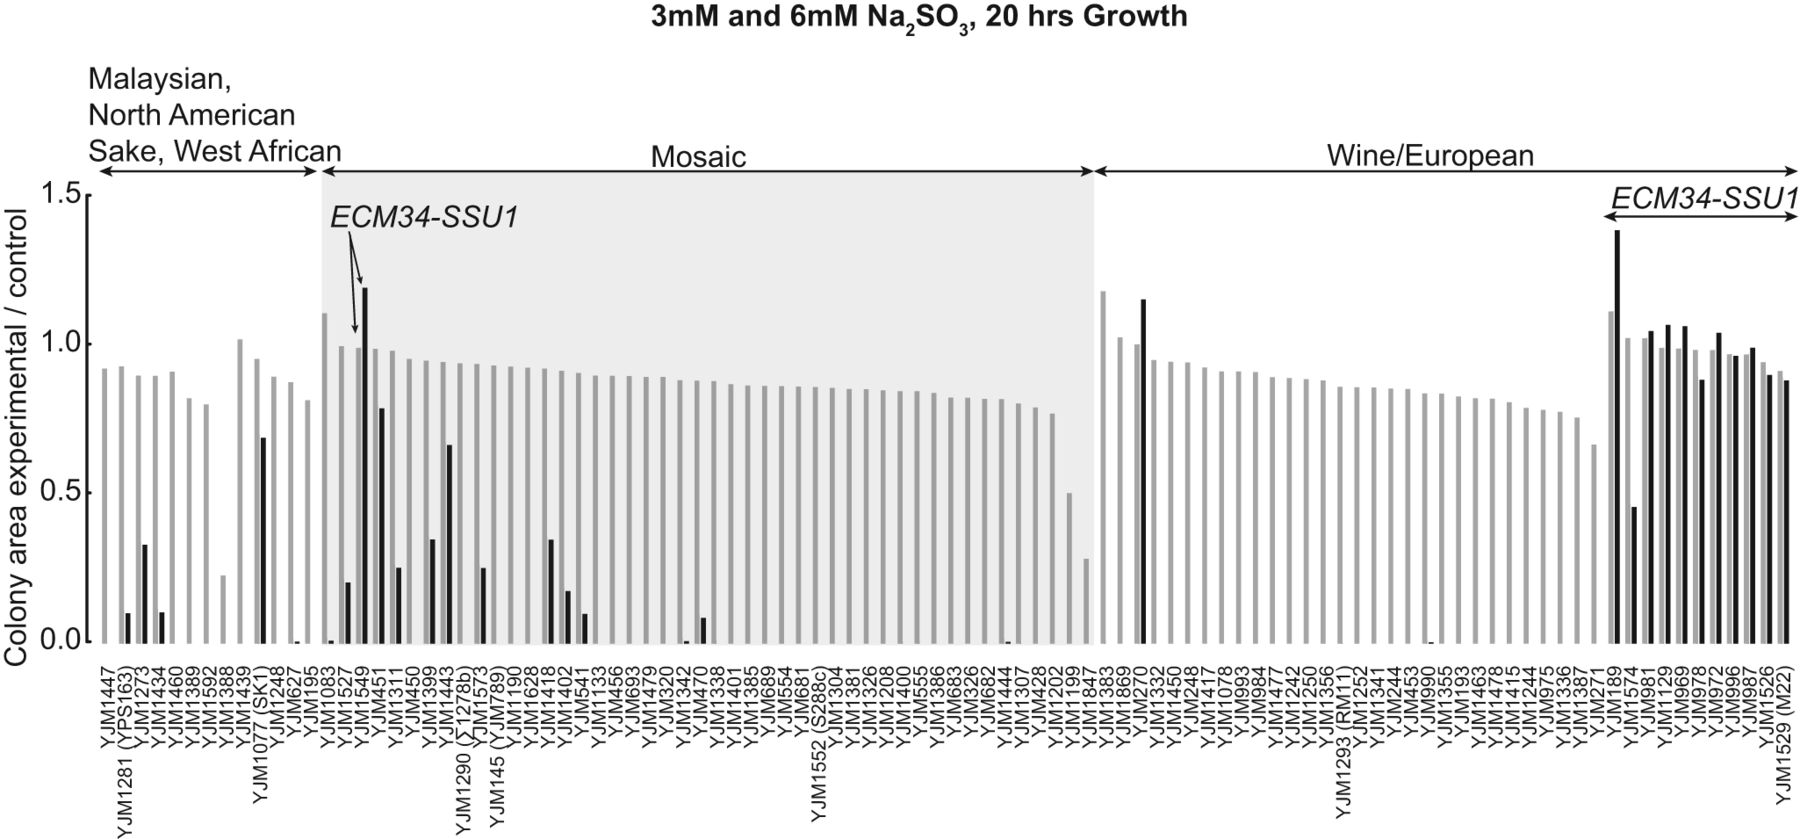
Figure 5.
Sulfite resistance phenotypes of the 100-genomes S. cerevisiae strains. Colony area as a measure of sulfite resistance (3 mM: gray bars; 6 mM: black bars). Strains are arranged by population structure. Strains with the ECM34-SSU1 translocation show higher sulfite resistance than those without the translocation.


