
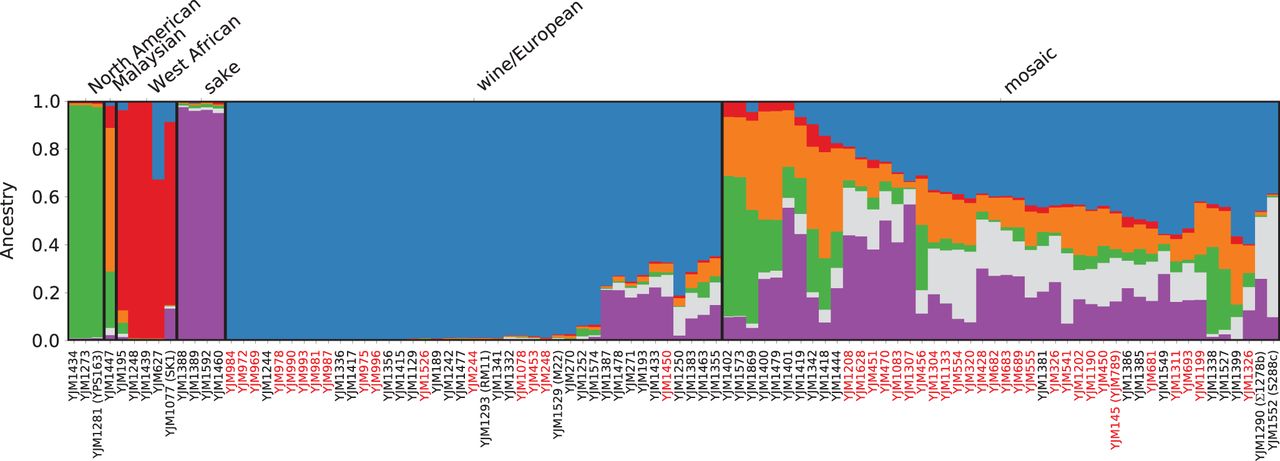
Population structure of the 100-genomes S. cerevisiae strains. Population structure inferred for 100 S. cerevisiae strains using the program structure (Pritchard et al. 2000). Each strain is represented by a single vertical line, which depicts fractional population ancestry from each of K = 6 subpopulations denoted by colors: green (North American), orange (Malaysian), red (West African), purple (sake), blue (wine/European), and gray (human-associated). Black boxes delineate the six strain populations. A threshold of 60% ancestry from any single population was used to construct groupings, except for mosaic strains that have <60% ancestry from any of the other five populations. Strain names in black and red indicate nonclinical and clinical environmental origin strains, respectively.


