
Figure 5.
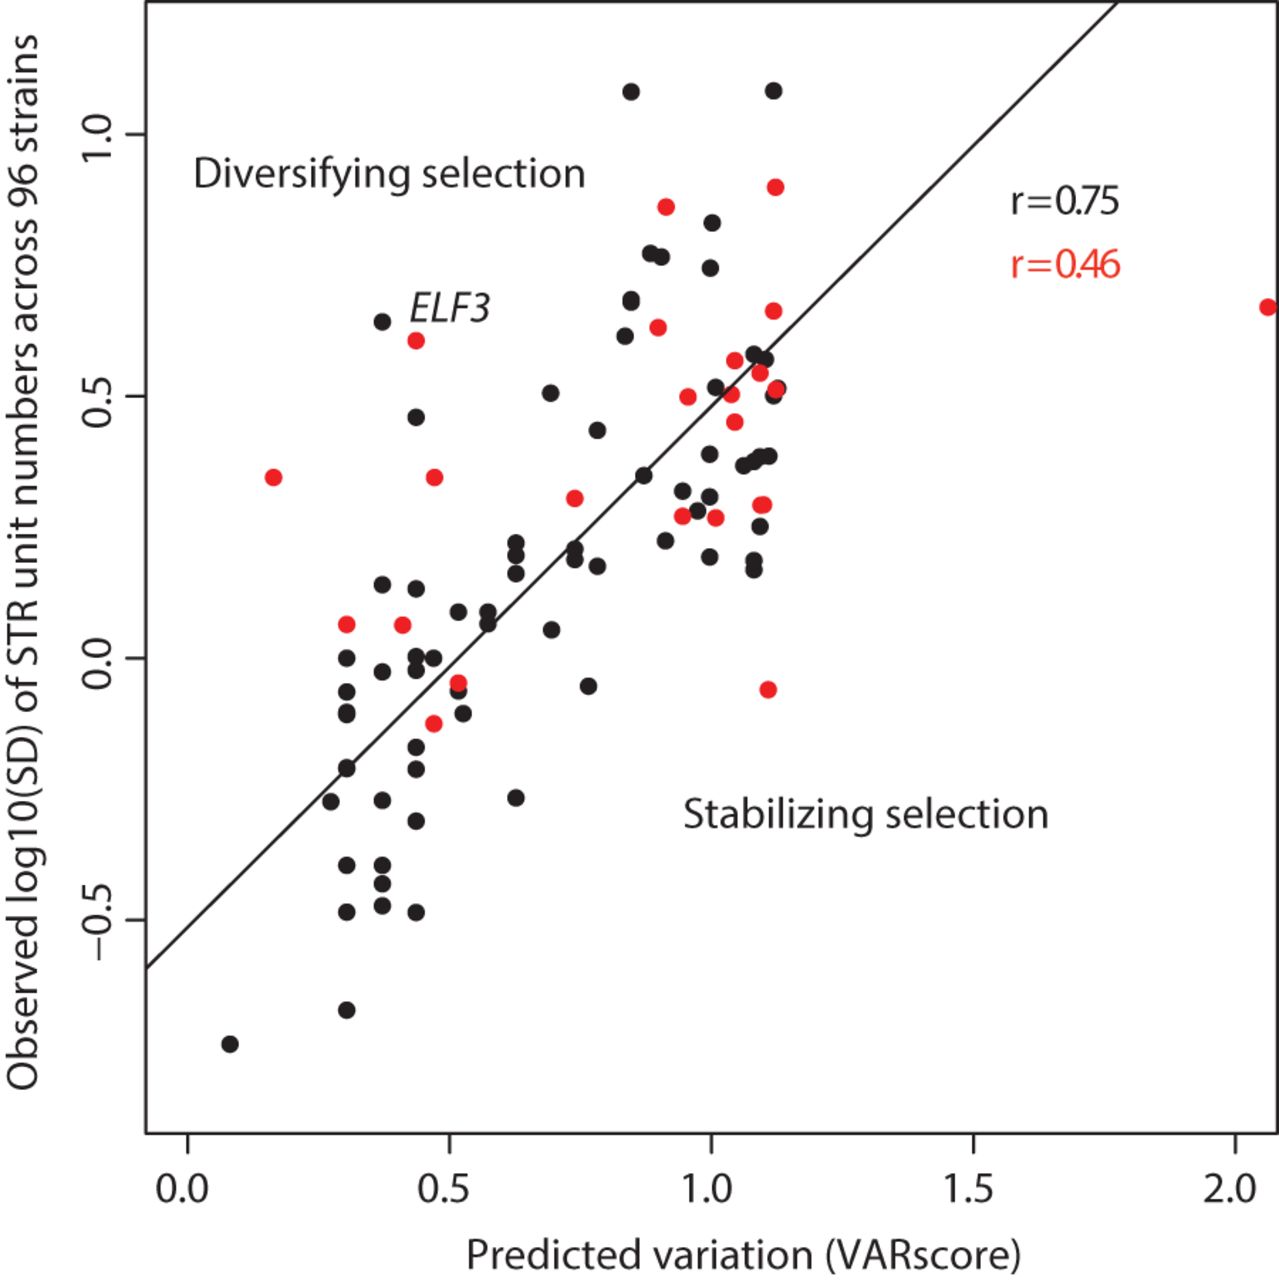
Observed and predicted STR variation showed greater correlation for noncoding STRs than coding STRs. The correlation between the observed log10 of the standard deviation of STR unit number across strains (y-axis) and the VARscore (x-axis), which predicts STR variation from sequence characteristics. Black points are noncoding STRs, red points are coding STRs. Outliers may indicate functional importance (ELF3 STR is indicated).


