
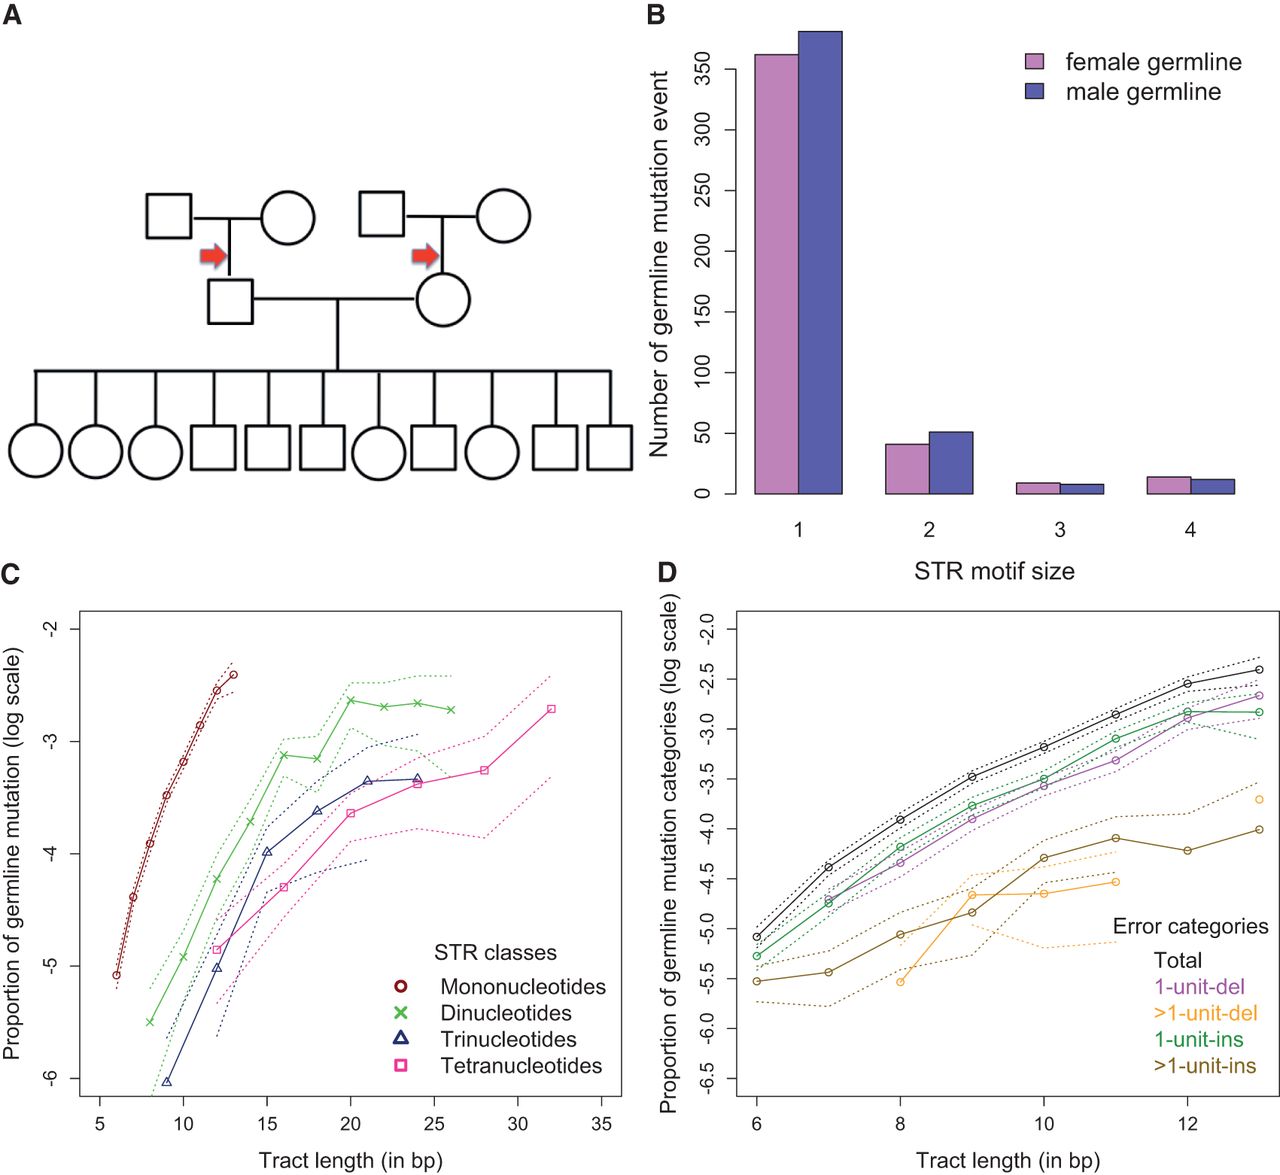
Figure 3.
Germline mutation rate analyses using STR-FM. (A) Cartoon of the pedigree used, with arrows showing branches where mutations were detected. (B) The numbers of de novo mutations arising in the male and female germ lines. (C) The germline mutation rates for STRs with different length and motif size. The dotted lines represent the 95% confidence interval of the multinomial sampling. Only repeat lengths with ≥2000 loci support were plotted. (D) The frequencies of different mutation categories for mononucleotide STRs. The dotted lines represent 95% confidence intervals from multinomial sampling. Only repeat numbers with ≥2000 loci support were plotted.


