
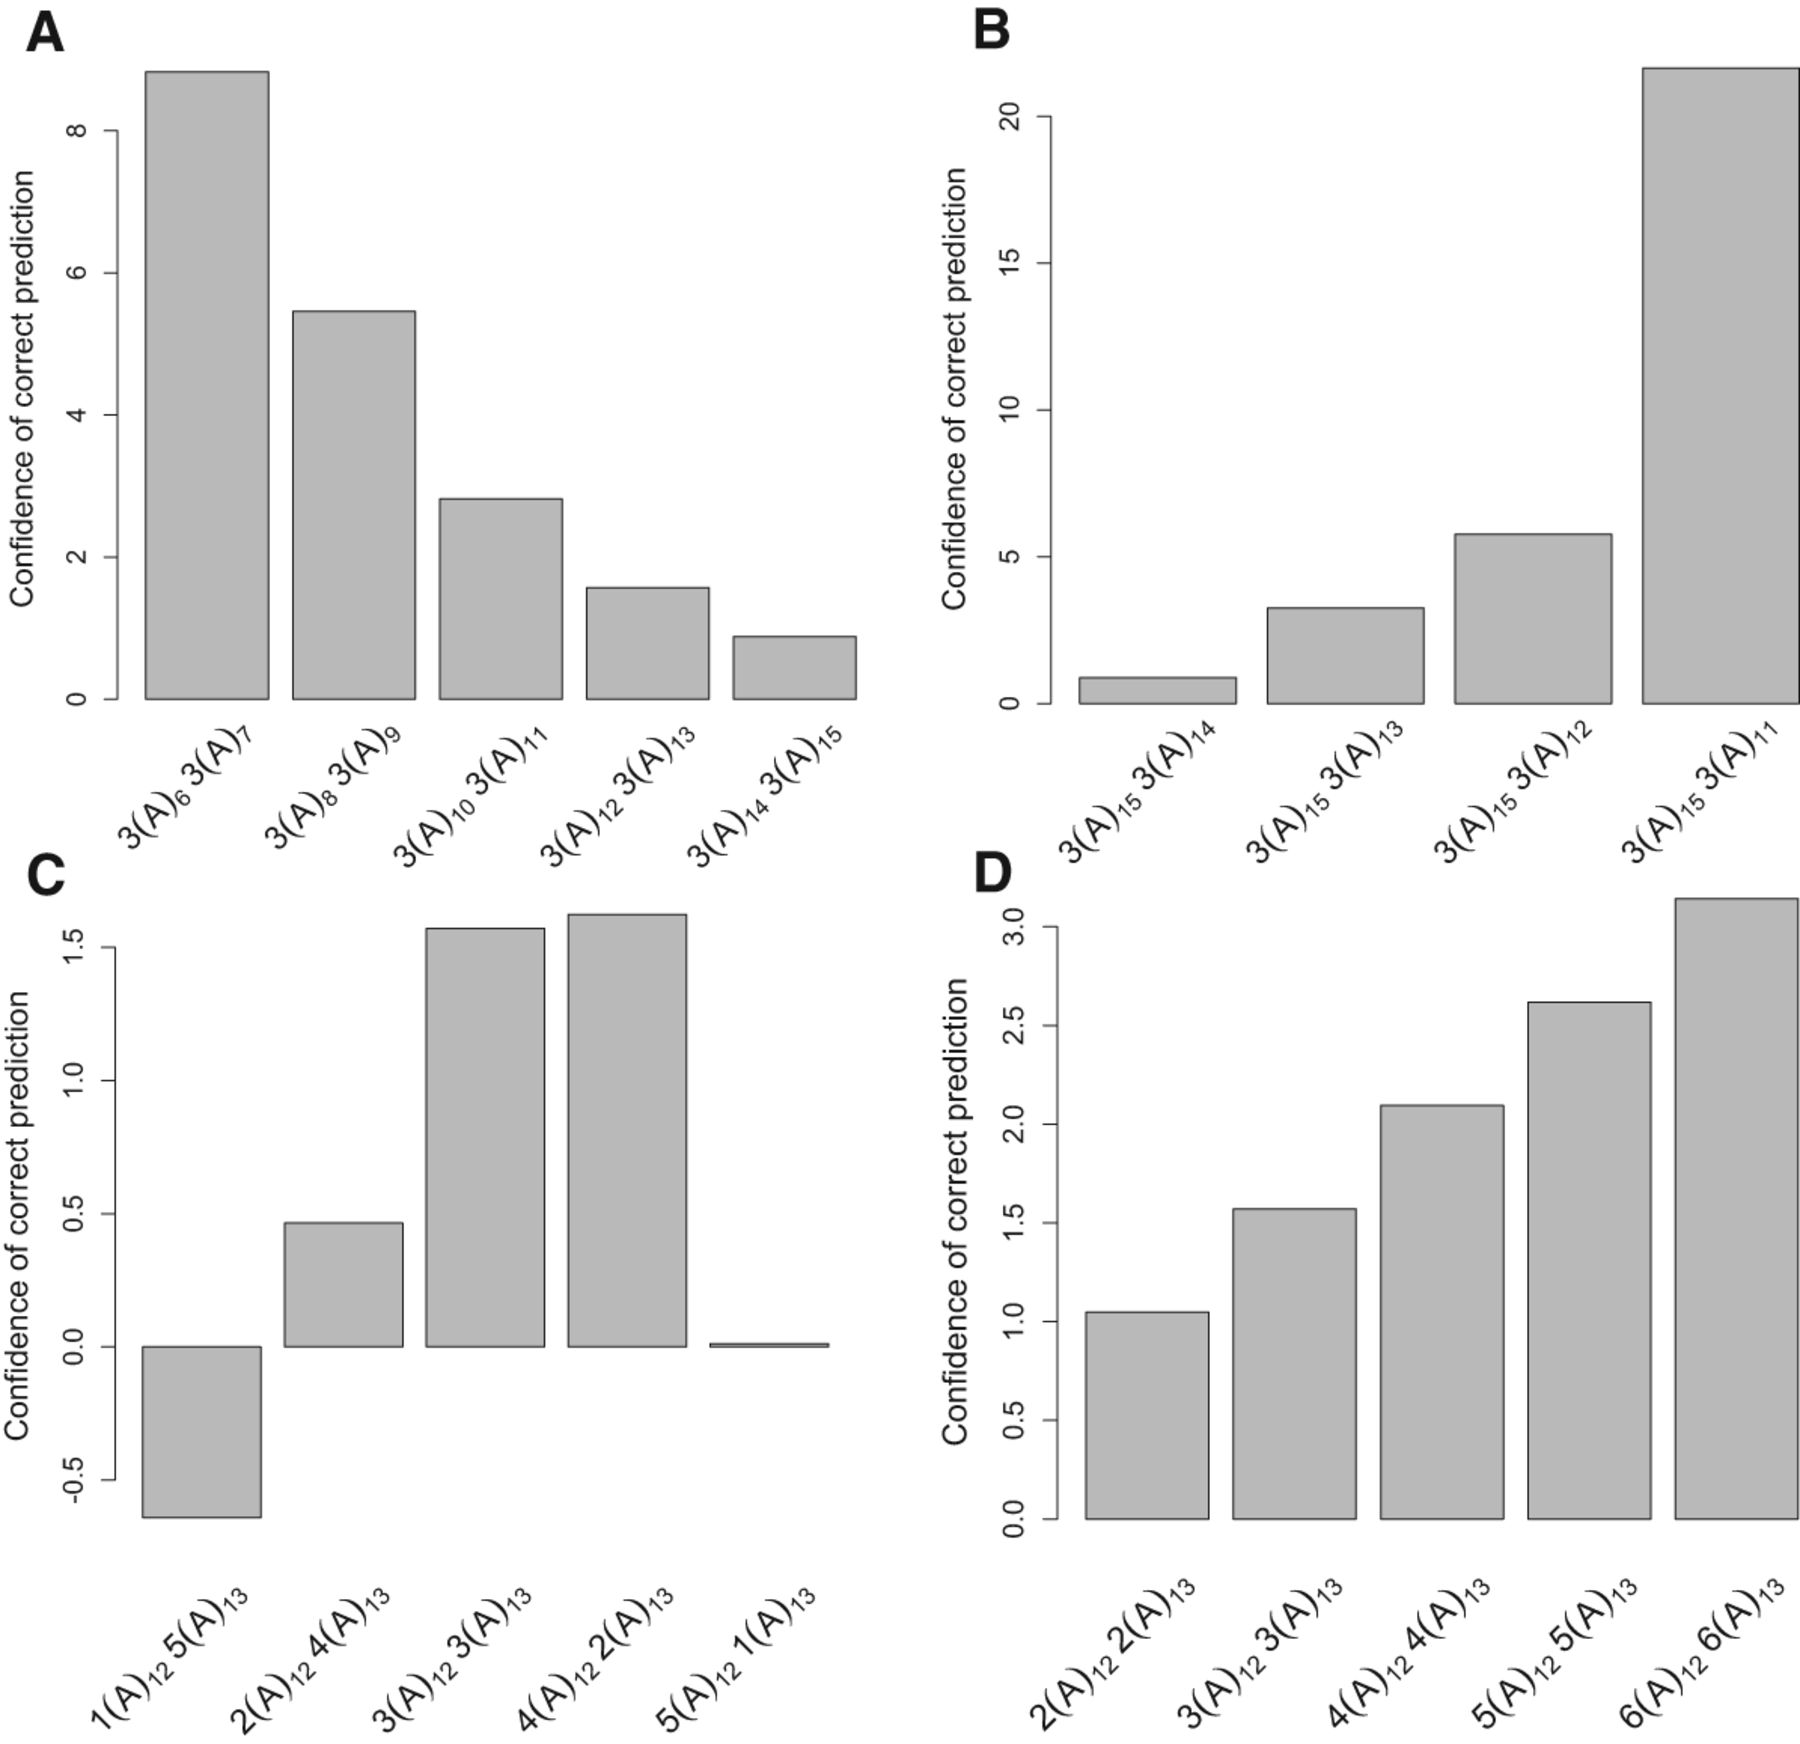
Factors that affect the accuracy of STR heterozygote genotyping, using the error correction model. (A) STR length. (B) The length difference in a heterozygote. (C) The ratio of read depths supporting each allele. (D) Read depth. All read profiles are generated from (A)m (A)n heterozygotes. The x-axis shows different STR length arrays, with the number of reads indicated for each genotype. The y-axis (confidence of correct prediction) shows the ratio of the probability for a locus to be a heterozygote versus a homozygote depending on the read length profile. The magnitude of the bar implies higher confidence in genotyping. The negative value indicates incorrect genotyping. PCR− error profiles from human X Chromosome data were used to calculate probabilities that the read profiles correspond to homozygous or heterozygous loci, which reflects the accuracy of genotyping, since the true genotype is a heterozygote.


