
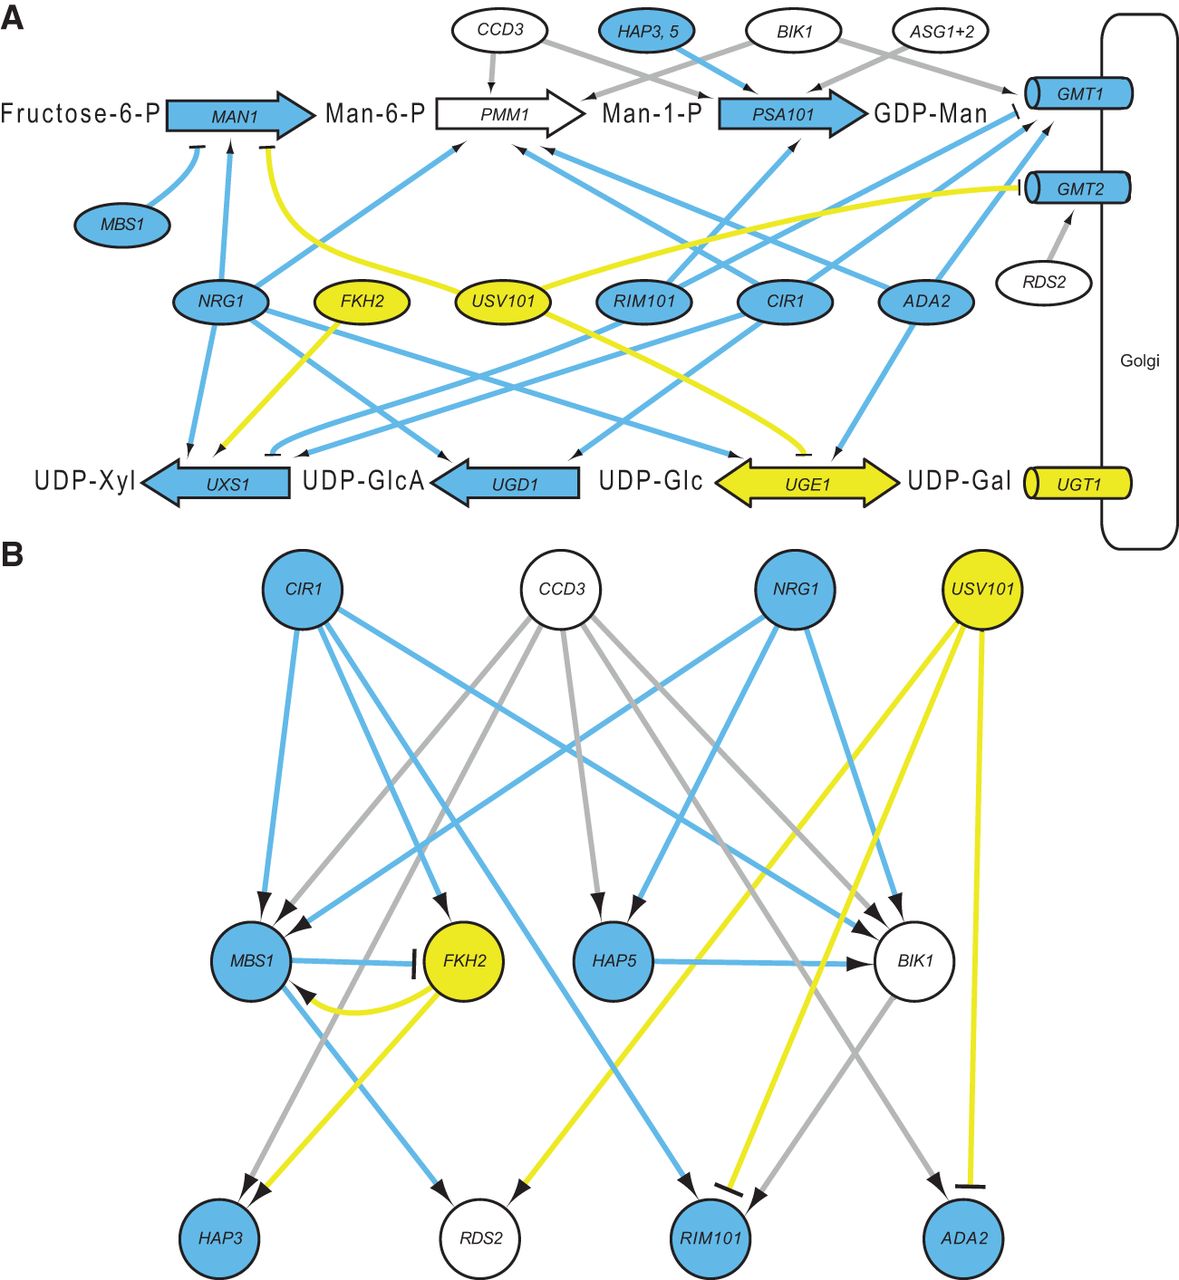
Regulation of upstream capsule biosynthetic pathways. (A) Network-derived regulatory relationships between TFs and the pathways that make and localize sugar donors for capsule synthesis, considering the top 10,000 NetProphet edges: (large labeled arrows) synthetic steps; (ovals) TFs; (cylinders) nucleotide sugar transporters in the Golgi membrane. Shapes are labeled with the corresponding gene name and filled blue if the mutants are hypocapsular, yellow if the mutants are hypercapsular, and white if the gene has not been deleted (PMM1) or the mutants have normal capsule thickness (all others). Arrowheads indicate activation and T-heads repression; edge colors reflect the phenotype of the regulator. ASG1 + 2 represents three genes that are normocapsular when deleted: ASG1, CCD6, and MAL13; HAP3,5 represents HAP3 and HAP5, both hypocapsular when deleted. (Man) mannose; (Xyl) xylose; (GlcA) glucuronic acid; (Glc) glucose; (Man1) phosphomannose isomerase; (Pmm1) phosphomannomutase; (Psa1) GDP-mannose pyrophosphorylase; (Uxs1) UDP-Xyl synthase (Bar-Peled et al. 2001); (Ugd1) UDP-Glc dehydrogenase (Bar-Peled et al. 2004; Moyrand and Janbon 2004); (Uge1) UDP-Glc epimerase. Gmt1 and Gmt2 are GDP-Man transporters (Cottrell et al. 2007; Wang et al. 2014), and Ugt1 is a UDP-Gal transporter (Moyrand et al. 2007); transporters for the other precursors have not been identified. (B) Network-derived regulatory relationships between the TFs shown in A, using the same colors and symbols except that TFs are circles. For clarity, only the top 10,000 NetProphet edges were used.


