
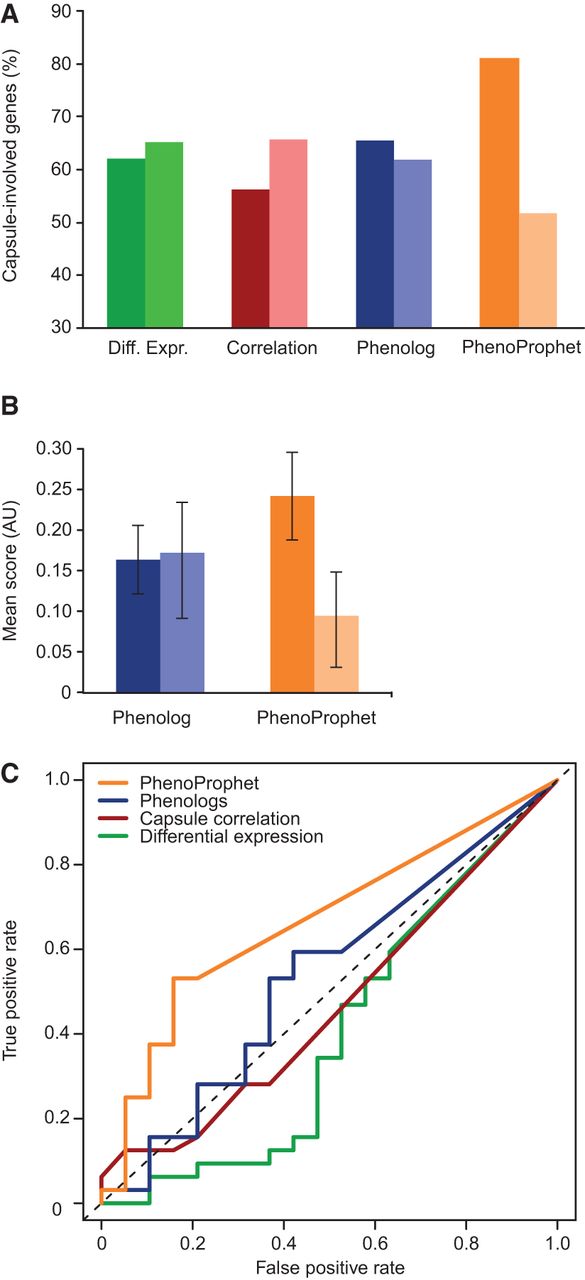
Methods comparison shows the power of PhenoProphet in predicting which TFs regulate a process of interest. (A) Four expression-based methods (x-axis) were used to predict whether cryptococcal regulators are involved with capsule formation (i.e., mutants show abnormal capsule; dark bars) or not (light bars). The set of genes in each category was then assessed for the fraction that actually does influence capsule (y-axis). (B) Mean and SEM of Phenolog and PhenoProphet scores for genes that are capsule involved (dark bars) or not (light bars). (C) Receiver operating characteristic analysis comparing the indicated methods for phenotype prediction to random expectation (dotted line).


