
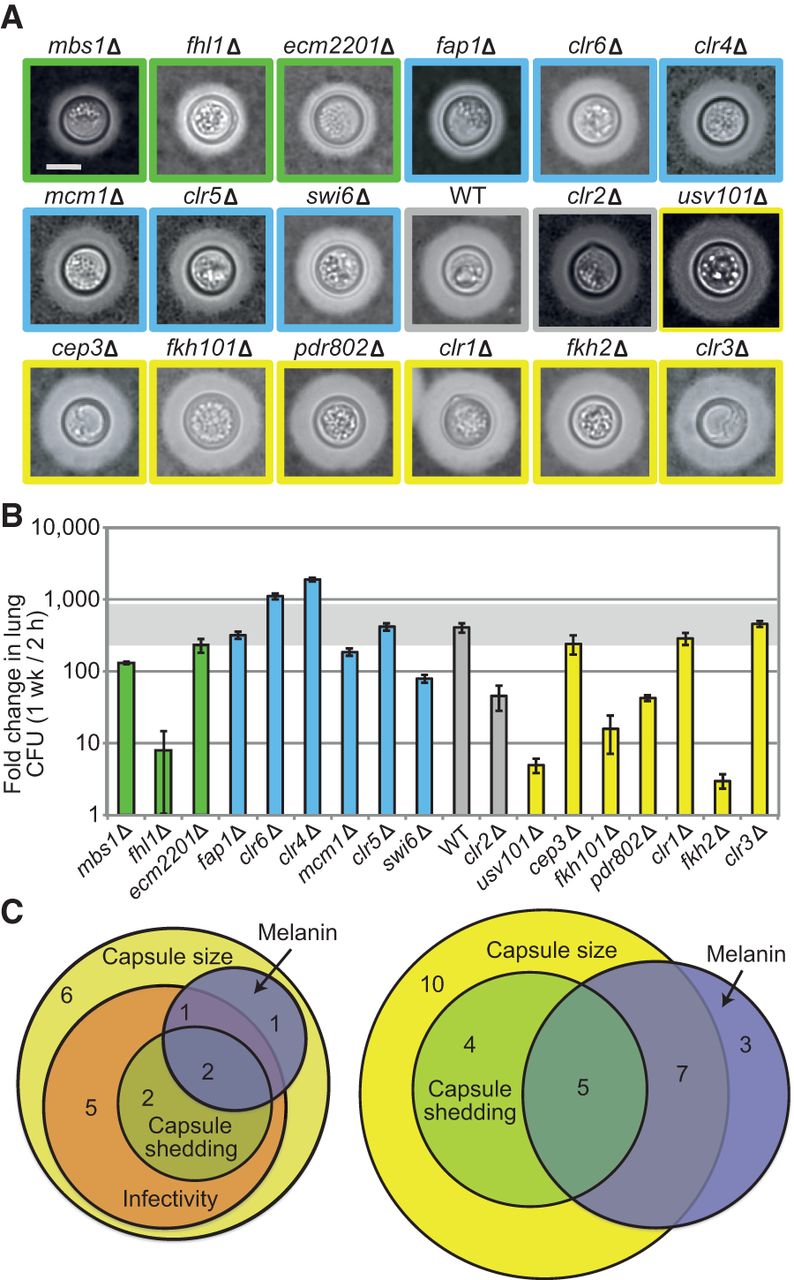
Virulence attributes of new regulatory mutants. (A) Representative cells of our new mutant strains, selected so all have similar cell wall diameter and each has capsule thickness very close to the average determined for that mutant. Images are all to the same scale and ordered by capsule size: (bar) 5 μm. Colors indicate capsule size groups as in Figure 2. (B) Mean ± SEM of infectivity results; horizontal gray bar denotes fold-increase values from 0.5 to twofold that of WT. All strains grew like WT on rich medium except for fhl1, which had a 2.5-fold higher doubling time. (C) Aberrant phenotypes of new mutants (left) and of all the mutants in Figure 2 (right). Melanin was scored for 37°C phenotype.


