
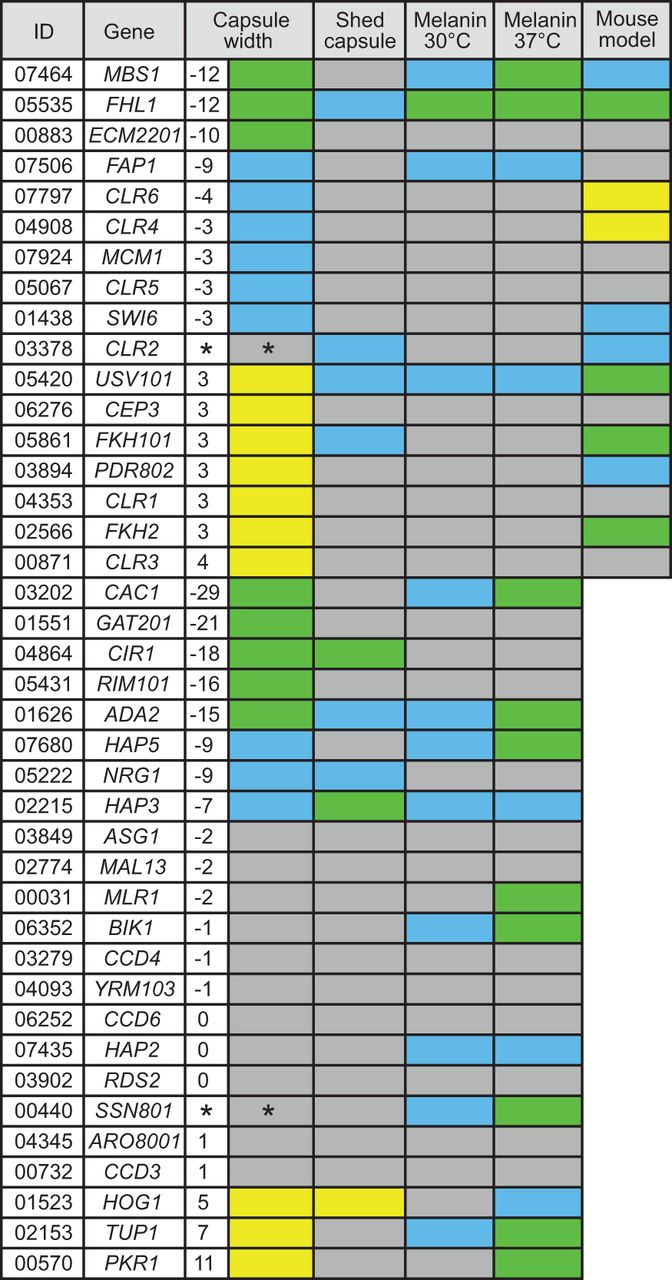
TF mutants have significant virulence-related phenotypes. For capsule, the difference in thickness from WT (in pixels) is tabulated and also color-coded: (green) a decrease of ≥10 pixels compared to wild type; (blue) a decrease of 3–9 pixels; (yellow) an increase of ≥3 pixels; (*) denotes strains with WT mean capsule thickness but significantly increased variance. For melanin formation, green indicates colonies that were white (no melanin) to beige, and blue indicates colonies that were brown but lighter than WT. For capsule shedding, green indicates that the 3-h culture supernatant concentration of GXM was ≥8-fold lower than WT; blue, two- to fourfold lower; and yellow, twofold higher. For short-term infectivity, fold-change in colony-forming units (CFU) in 1 wk was calculated (tested only for strains with newly discovered capsule phenotypes): (green) >10 times lower than WT; (blue) 2–10 times lower; (yellow) >2 times higher. In all columns gray indicates no significant change in phenotype.


