
Figure 1.
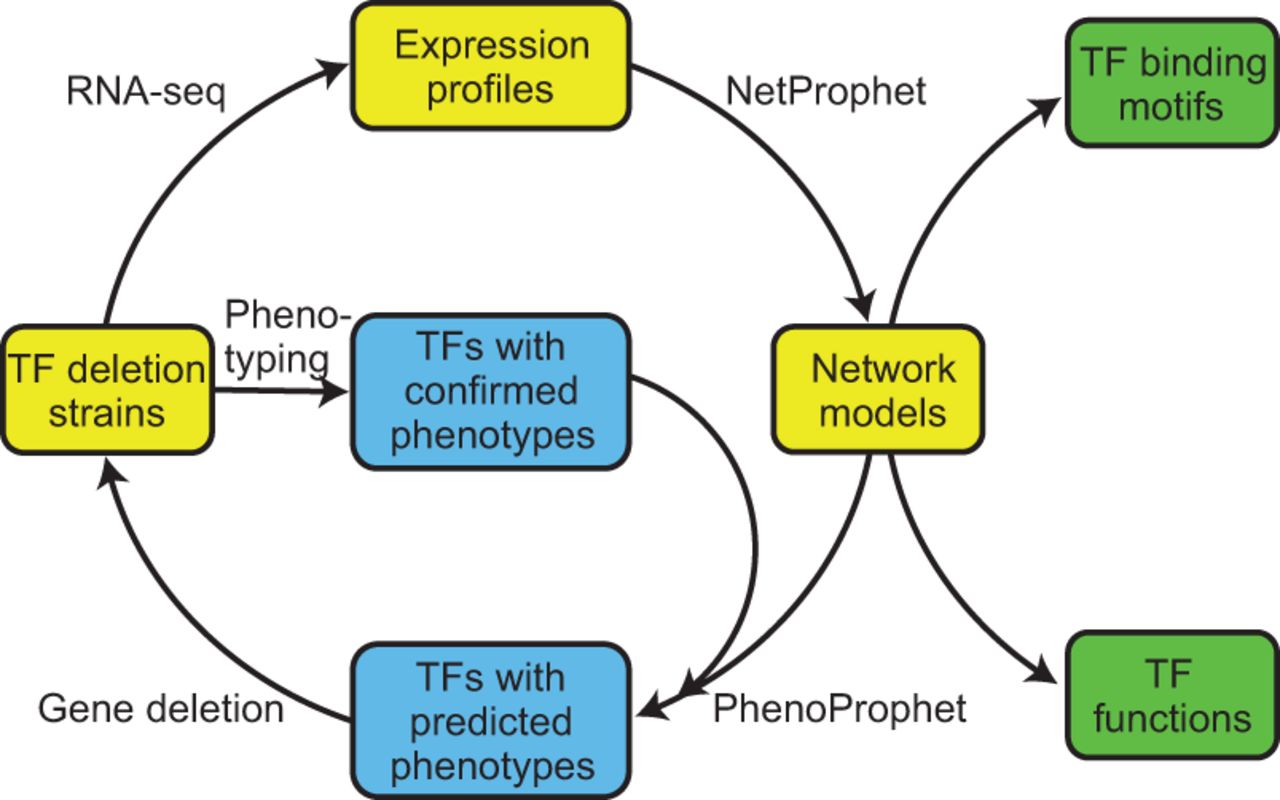
NetProphet–PhenoProphet workflow. (Yellow) Steps involved in network modeling; (blue) steps involved in network refinement to elucidate a specific process of interest; (green) products of genome-wide network analysis.
(Downloading may take up to 30 seconds. If the slide opens in your browser, select File -> Save As to save it.)
Click on image to view larger version.
NetProphet–PhenoProphet workflow. (Yellow) Steps involved in network modeling; (blue) steps involved in network refinement to elucidate a specific process of interest; (green) products of genome-wide network analysis.
 CiteULike
 Delicious
 Digg
Digg Facebook
 Google+
 Reddit
 Twitter
