
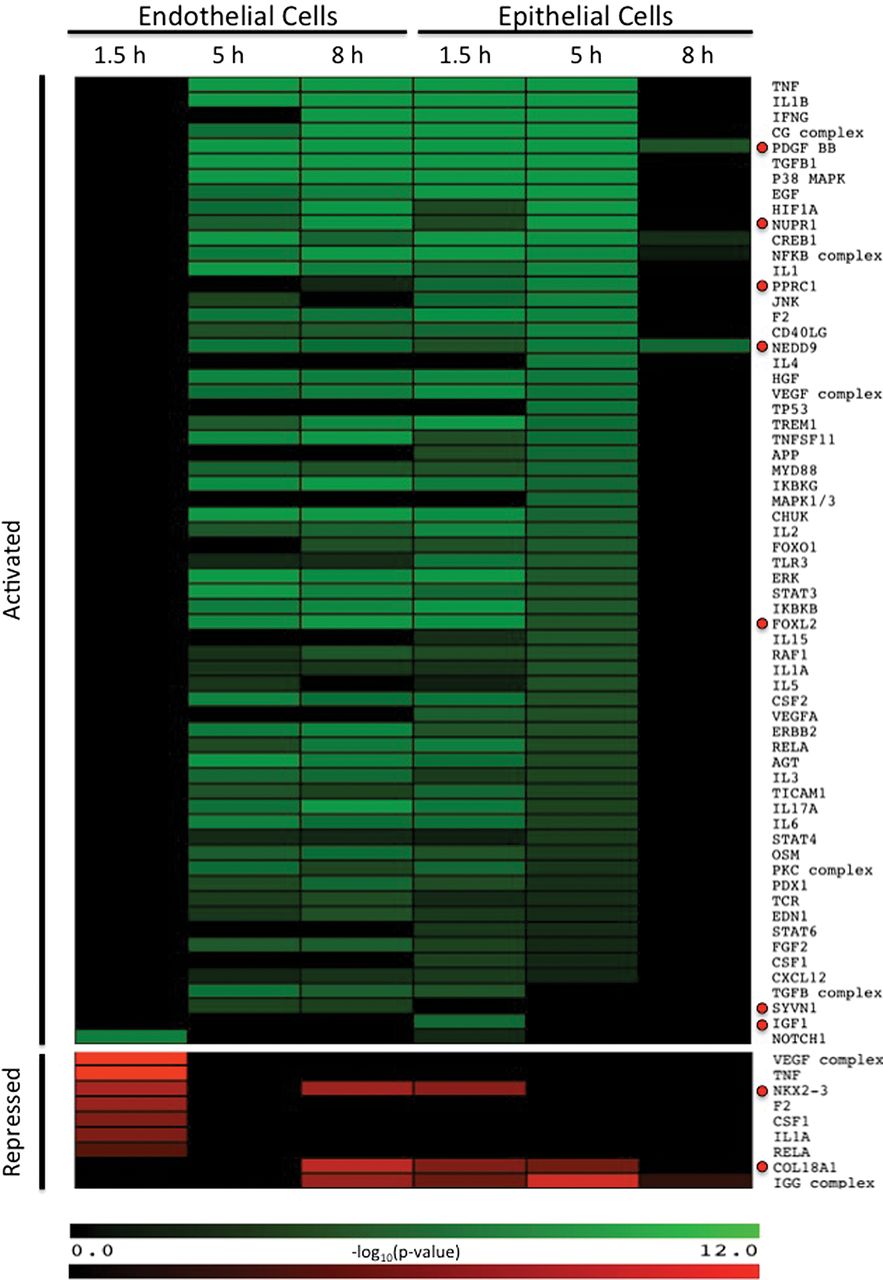
Upstream regulator analysis of host gene expression. Each regulator was predicted by Ingenuity Pathway Analysis (IPA) to be activated (green, Z-score > 2) or repressed (red, Z-score < −2) during infection with C. albicans in either endothelial cells or epithelial cells during at least one time point. Depicted are the regulators with the highest predicted regulations (Z-score). Values represent −log10(P-value) for the overlap between the target gene set of each regulator and the list of differentially expressed genes. Black indicates no predicted activation or repression. Red circles indicate regulators that have not been previously associated with the host response to C. albicans infection.


