
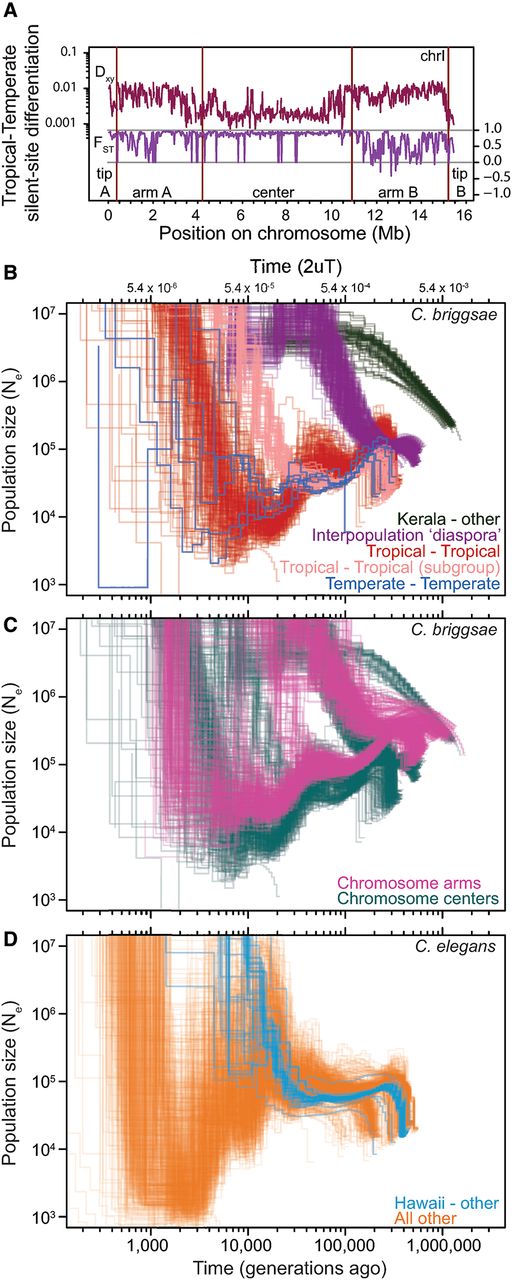
Demographic history of C. briggsae and C. elegans populations. (A) Relative measures of population differentiation (FST) are greater in chromosome centers between Temperate and Tropical phylogeographic groups. In contrast, the Dxy measure of absolute divergence between populations shows the opposite trend, indicative of selection at linked sites being stronger in the low recombination chromosome centers (Pease and Hahn 2013; Cruickshank and Hahn 2014). Window of 20 kb for silent sites along Chromosome I is shown as an exemplar of all chromosomes (Supplemental Fig. 2). Iterated pairwise sequential Markovian coalescent (PSMC) analysis of all C. briggsae (B,C) and C. elegans (D) genomes show the history of population size change and population splitting. Each line represents the change in population size (Ne) through time inferred for a pair of genomes, with all pairs of haploid genomes among the 37 strains of C. briggsae and 40 strains of C. elegans superimposed to indicate biological replication in the inference of demographic patterns. PSMC curve profiles restricted to the upper right in B illustrate the deep divergence of Kerala strains to all others (approximately 2 million generations ago; green) and the more recent “diaspora” of several genetically distinct strain groups from each other nearly simultaneously 300,000–500,000 generations (Kgen) ago (purple). PSMC profiles within each of the Tropical (red, pink) and Temperate phylogeographic groups show Ne fluctuations in their past, with larger Ne in the distant past and a recent population split within the Tropical group (pink versus red). Only analyses of chromosome center domains are shown in B. PSMC profiles of C. briggsae strain pairs from within a phylogeographic group other than Temperate and Tropical are not shown. Rapid recent time Ne increases likely reflect an artifact of the PSMC algorithm in estimating Ne on short timescales (Li and Durbin 2011). (C) PSMC profiles involving Tropical strain comparisons with all other strains partitioned according to chromosomal domain: (cyan) center domain; (magenta) arm domain. Low recombination chromosome centers have lower Ne and more recent coalescence, and the ancestral polymorphism that generates heterogeneity in the PSMC profiles of the “diaspora” differentiation of phylogeographic groups 300–500 Kgen ago is more constricted for chromosome centers. (D) PSMC analysis of C. elegans indicates a split of the Hawaiian CB4856 strain (blue; 30–50 Kgen ago) with all other strains in the sample (orange), and an overall strong decline in population time since then. Analyses of chromosome centers are shown, with analysis of arm regions in Supplemental Figure 8, excluding 14 of 703 C. briggsae strain pairs and 10 of 780 C. elegans strain pairs owing to spurious PSMC profiles.


