
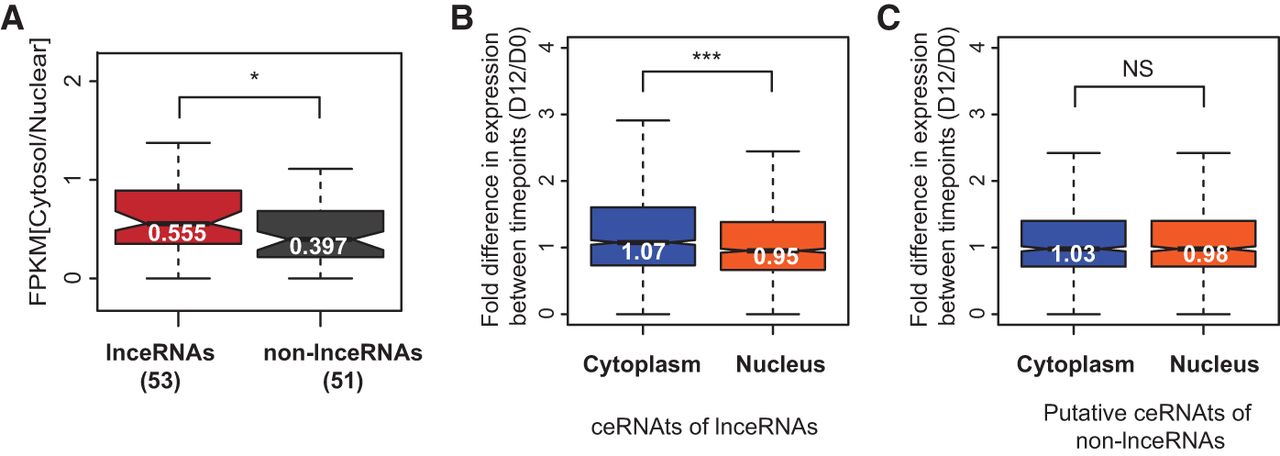
Figure 3.
lnceRNAs are enriched in the cytoplasm. (A) Ratio between gene expression (in FPKM) in the cytoplasmic and nuclear fraction for lnceRNAs (red, r = 0.555) and lncRNAs that were not annotated as lnceRNAs (gray, r = 0.397). Relative fold difference in expression measured in the cytoplasm (blue) and nucleus (orange) of cells before (day 0) and after (day 12) Dicer1 loss-of-function for ceRNAts and putative ceRNAts of (B) lnceRNAs and (C) non-lnceRNAs. Median fold differences are shown in the corresponding box plot. (NS) Not significant, (*) P < 0.05, (***) P < 0.001.


