
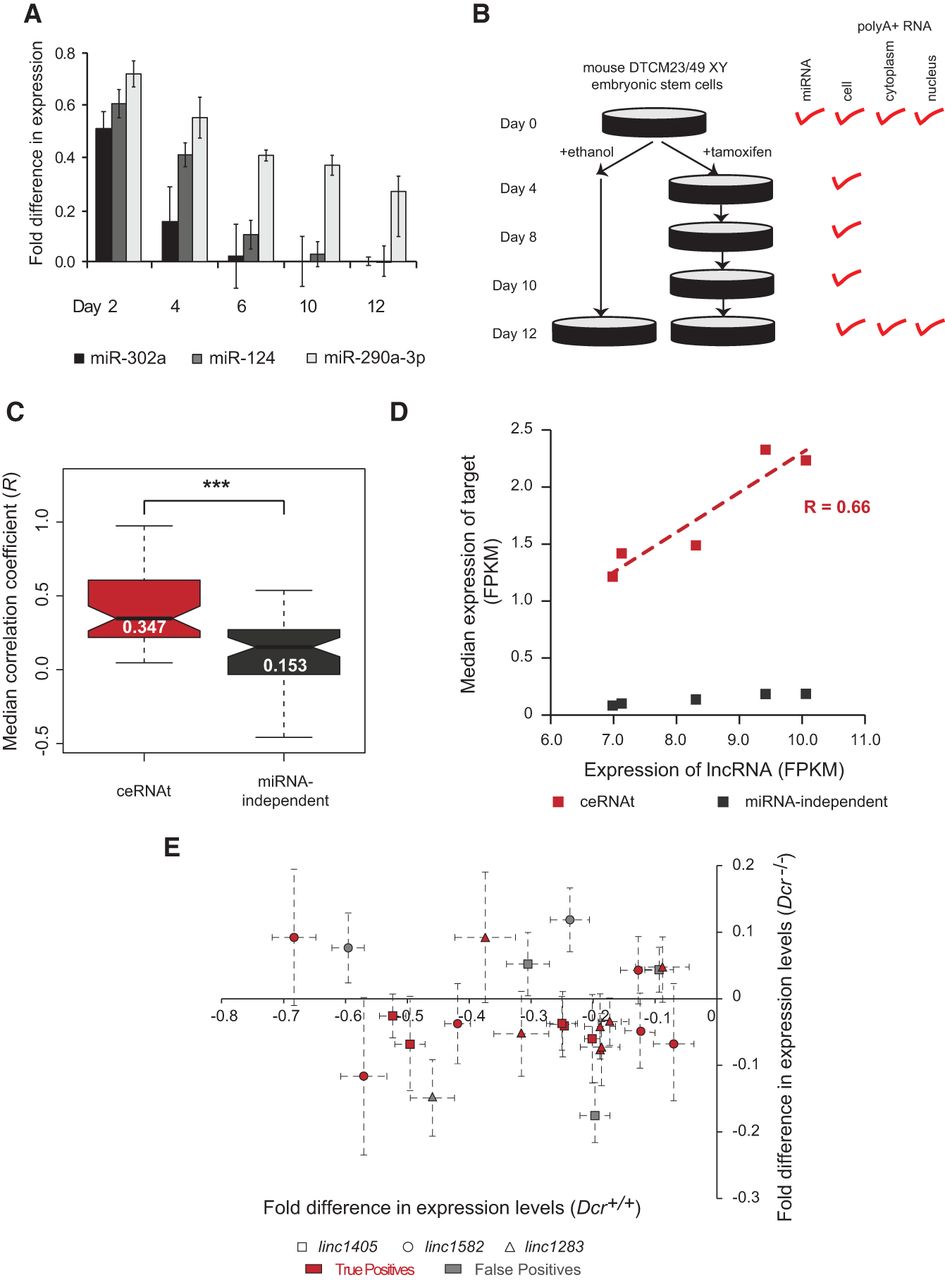
The expression levels of lncRNAs and their ceRNAts are positively correlated upon loss of miRNA biogenesis. (A) Loss of miRNA biogenesis (Dcr−/−) is associated with decreased levels, relative to the wild-type control, of mature miR-302a (black), miR-124 (dark gray), and miR-290a-3p (light gray) abundance over a 12-d time course. Fold difference in expression relative to controls was determined using qRT-PCR in triplicate. (B) Long poly(A)-selected RNA from total cellular extracts of DTCM23/49 XY mouse embryonic stem cells (mESCs) was collected on days 0, 4, 8, 10, and 12 following exposure to tamoxifen. Long poly(A)-selected RNA was also collected from the nucleus and cytoplasm of these cells before (0) and 12 d after treatment with tamoxifen. Total RNA used to quantify miRNA expression was extracted before tamoxifen treatment. (C) Median correlation coefficients between lncRNA expression and their respective ceRNAts (red, median R = 0.347) and miRNA-independent targets (dark gray, R = 0.153) over the 12-d time course following loss of miRNA biogenesis. (D) Pearson's correlation between linc1510’s expression (average across replicates of the gene expression measured as fragment per kilobase of exon per million reads mapped [FPKM], x-axis) and the median expression of all of its targets annotated as either ceRNAts (R = 0.66, red) or miRNA-independent targets (R = 0.19, dark gray) at each time point (y-axis). (E) Fold difference in normalized (using Gadph) gene expression following knockdown of linc1405 (square symbols), linc1582 (circles), or linc1283 (triangles) and siRNA transfection control in Dcr+/+ (x-axis) or Dcr−/− (y-axis) mESCs. True and false ceRNA positives are highlighted in red or gray, respectively. Error bars represent S.E.M. across replicates. (***) P < 0.001.


