
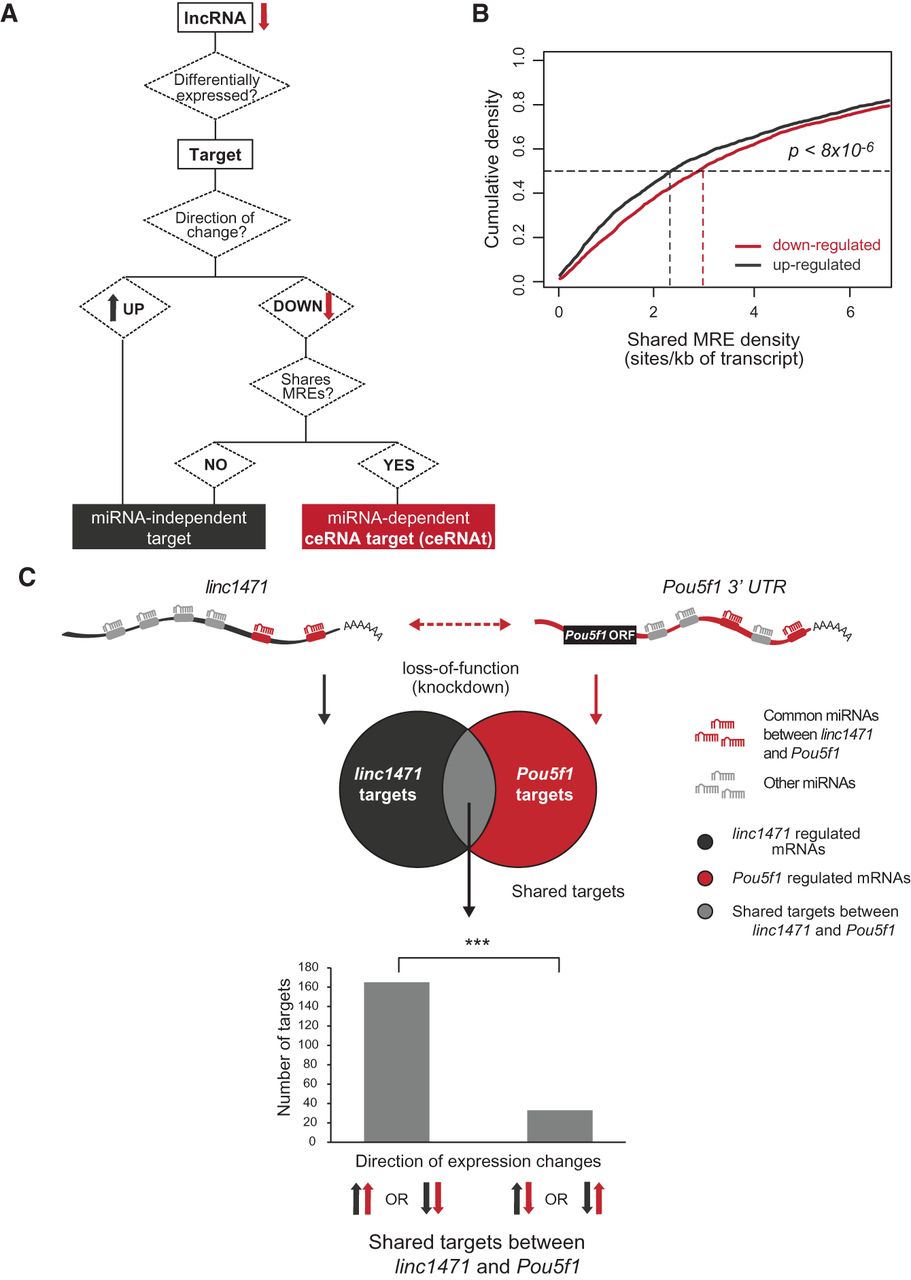
MiRNA-dependent regulation of mRNA abundance by lncRNAs. (A) Diagram illustrating the classification of an individual lncRNA's mRNA target as either a competitive endogenous RNA target (ceRNAt) (red) or an miRNA-independent target (dark gray). Red and dark gray arrows represent down- and up-regulation, respectively. (B) Cumulative distribution plots for the density of predicted miRNA response elements (MREs) for the top 25% most highly expressed miRNA families in mESCs shared between lncRNAs and their respective down-regulated targets (median = 2.9 sites/kb of transcript, red) and up-regulated targets (median = 2.3 sites/kb of transcript, black). (C) Transcription factor Pou5f1 (red) is predicted to compete (dotted red arrow) for binding to miR-421 and miR-762 MREs (red oblongs within transcript) with linc1471 (dark gray). MREs for miRNAs not shared between the two genes are represented in light gray. Bar chart represents the number of miRNA-independent targets of linc1471 that are shared with Pou5f1, whose levels changed in the same or opposite direction upon linc1471 (dark gray) or Pou5f1 (red) knockdown. Arrows indicate the direction of the observed expression changes following linc1471 and Pou5f1 knockdown. (***) P < 0.001.


