
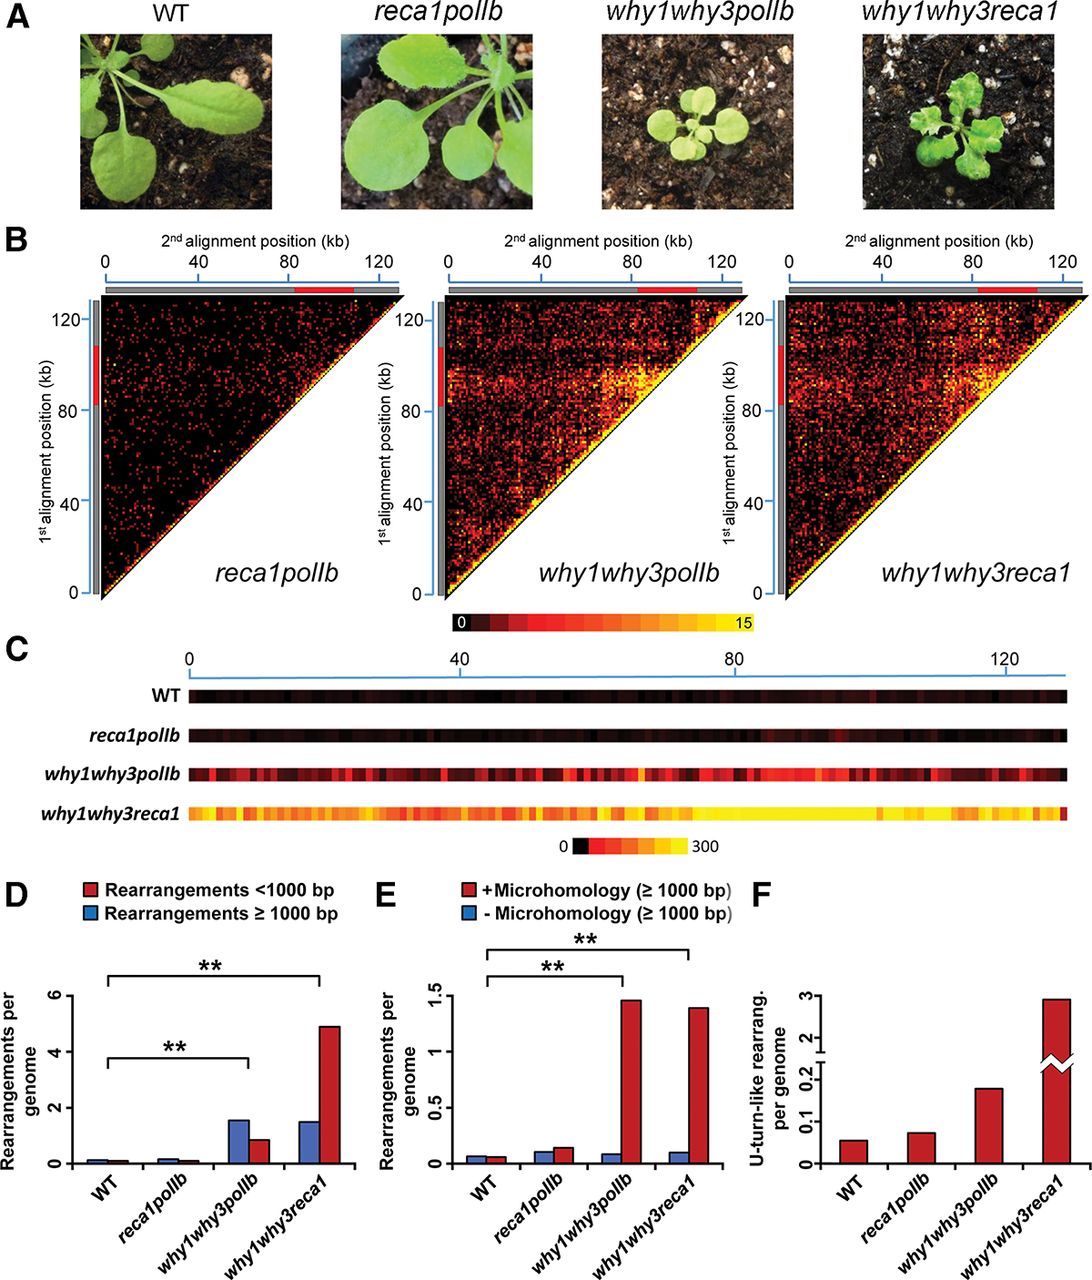
Global portrait of plastid genome rearrangements in Arabidopsis mutant lines reca1polIb, why1why3polIb, and why1why3reca1. (A) Representative photographs of 21-d-old WT, reca1polIb, why1why3polIb, and why1why3reca1 Arabidopsis mutant plants. (B) Plastid rearrangement breakpoint positions of the indicated Arabidopsis mutant lines. Heatmaps depict each rearrangement as the intersection of the two genomic positions corresponding to the nucleotide on each side of the junction. Each tile represents a region spanning 1 kb along each axis. Tile intensity represents the number of rearrangements per 10,000 plastid genomes. All rearrangements mapping to the plastid large inverted repeats (IRs) were only assigned to the first IR. The plastid large single-copy region (LSC), the first IR, and the small-single copy region (SSC) are depicted as a long gray bar, a red bar, and a short gray bar, respectively. (C) Short-range (<1000 bp) plastid rearrangement breakpoint positions of the indicated Arabidopsis mutant lines. Each heatmap tile represents a region spanning 1 kb along the genome and the number of rearrangements per 10,000 plastid genomes. All rearrangements mapping to the plastid large inverted repeats (IRs) were only assigned to the first IR. (D) Normalized amount of short-range (<1000 bp) and long-range (≥1000 bp) rearrangements per plastid genome for each of the indicated mutant lines. (E) Normalized amount of long-range rearrangements (≥1000 bp) per plastid genome displaying a microhomology (≥5 bp) (red) or not displaying a microhomology (blue) at their junction for each of the indicated mutant lines. (F) Normalized amount of rearrangements corresponding to short-range inversions (<50 bp, U-turn-like rearrangements) in each mutant line. Data were normalized on the total number of plastid genome reads. Two asterisks indicate a significant difference with P-value < 0.00001 using a χ2 test.


