
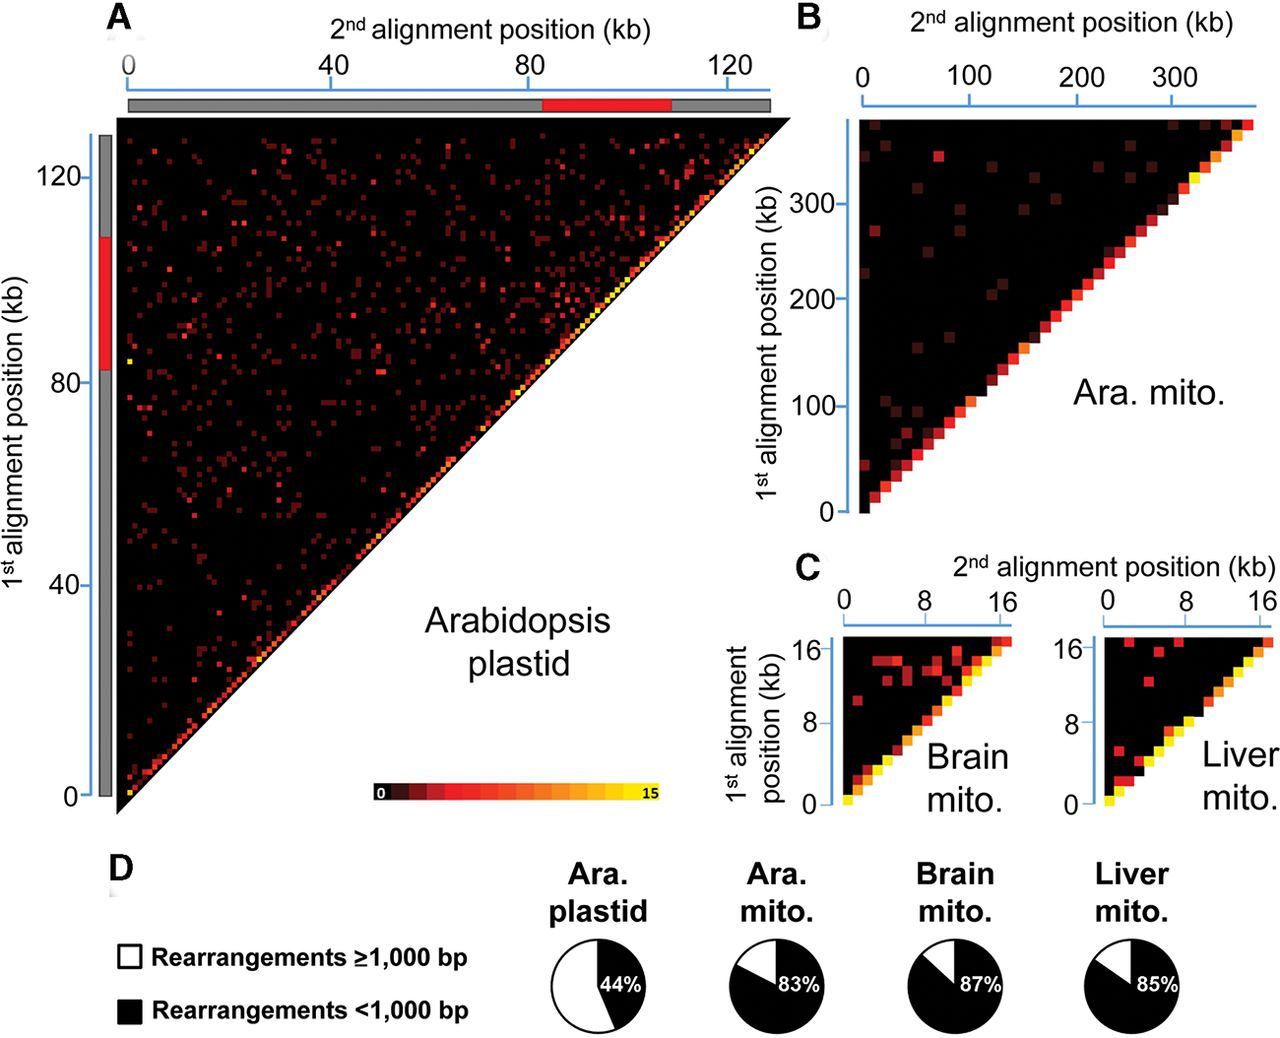
Global portrait of organelle genome rearrangements in Arabidopsis and humans. Heatmaps depict each rearrangement as the intersection of the two genomic positions corresponding to the nucleotide on each side of the junction. (A) Rearrangement breakpoint positions of Arabidopsis thaliana (Col-0) plastids. Each tile represents a region spanning 1 kb along each axis. Tile intensity represents the number of rearrangements per 10,000 plastid genomes. All rearrangements mapping to the plastid large inverted repeats (IRs) were only assigned to the first IR. The plastid large single-copy region (LSC), the first IR, and the small-single copy region (SSC) are depicted as a long gray bar, a red bar, and a short gray bar, respectively. (B) Rearrangement breakpoint positions of wild-type Arabidopsis thaliana (Col-0) mitochondria. Each tile represents a region spanning 10 kb along each axis. Tile intensity represents the number of rearrangements per 100 mitochondrion genomes. (C) Rearrangement breakpoint positions of a representative sample for human brain (ERX385572) and liver (ERX385578) mitochondria. Each tile represents a region spanning 1 kb along each axis. Tile intensity represents the number of rearrangements per 10,000 mitochondrion genomes. (D) Proportion of short-range (breakpoint positions <1000 bp apart) and long-range (breakpoint positions at least 1000 bp apart) rearrangements of Arabidopsis thaliana (Col-0) plastid, mitochondrion, and of the mean of the four samples for brain and liver mitochondria. (Ara.) Arabidopsis, (mito.) mitochondrion.


