
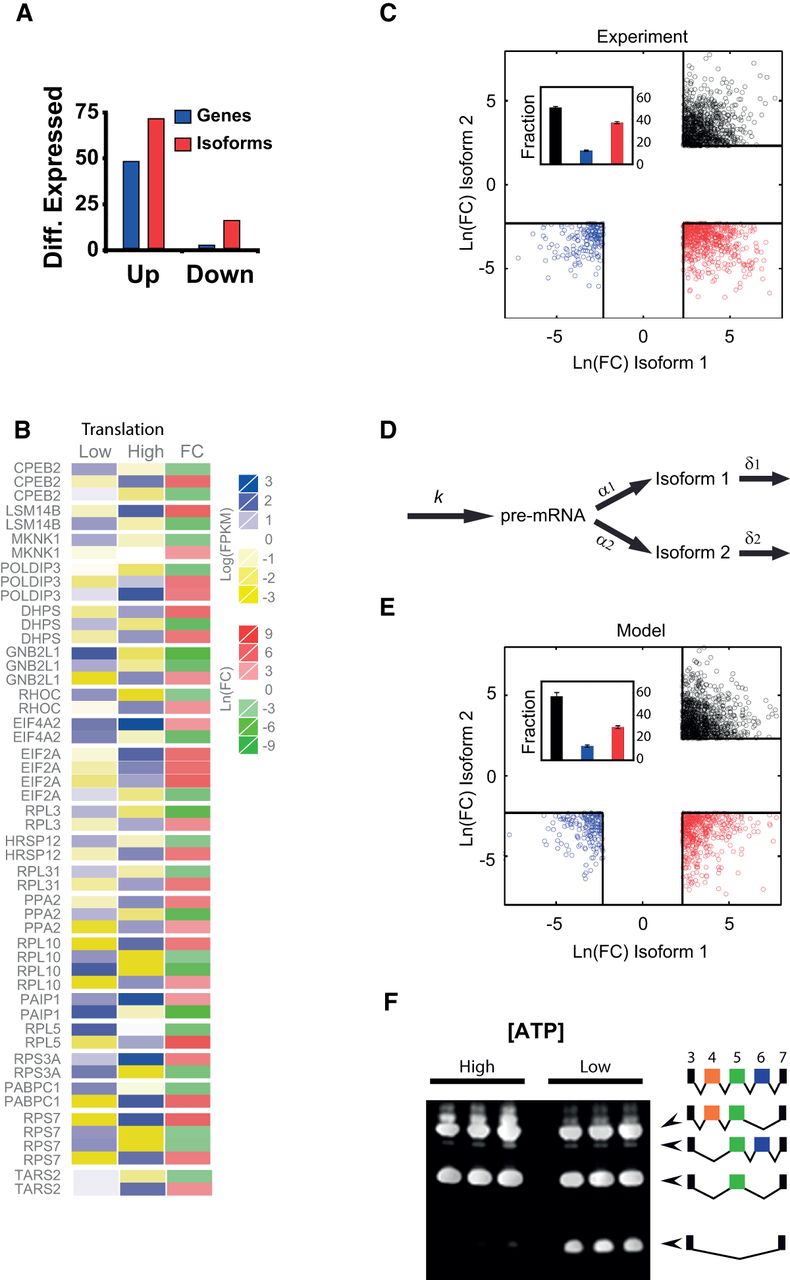
Effect of mitochondrial content on alternative splicing. (A) Variability in mRNA isoform expression is larger than variability in average gene expression. We show the fraction of isoforms up-regulated (FC > 3) or down-regulated (FC < 1/3, red bars) by mitochondrial content compared with the fraction of genes up- or down-regulated (blue bars). (B) Heat map displaying the levels of expression in High and Low cells (blue to yellow) and the logarithmic FC (red to green). This panel shows a group of genes in which alternative mRNA types are inverted in High versus Low cells. (C) Scatter plot of logarithmic FCs for pairs of alternatively spliced transcripts with FC > 10(FC < 1/10). The threshold value of FC (black squares) defines three domains in which AS is drastically altered by mitochondrial content: (black) both AS forms are overexpressed in mito-high conditions; (blue) both forms are down-regulated; (red) one form is overexpressed and the other is underexpressed. The inset shows the quantification of the fraction of dots in each domain. (D) Schematic representation of the two-step model involving pre-mRNA formation (with transcription rate k) and conversion to alternatively spliced forms with splicing rates α1 and α2. These mature mRNA forms can be degraded with rates δ1 and δ2, respectively. (E) Scatter plot of logarithmic fold changes for pairs of alternatively spliced forms simulated from the two-step model (see Supplemental Text for details). The threshold in FC and color code is the same as in B. (F) Changes in ATP affect alternative splicing. Jurkat cells treated for 12 h with deoxyglucose, which affects the splicing of PTPRC. Under low ATP conditions, the spliced form of PTPRC lacking exons 4, 5, and 6 is overexpressed. For both treatments, each line is a biological replicate.


