
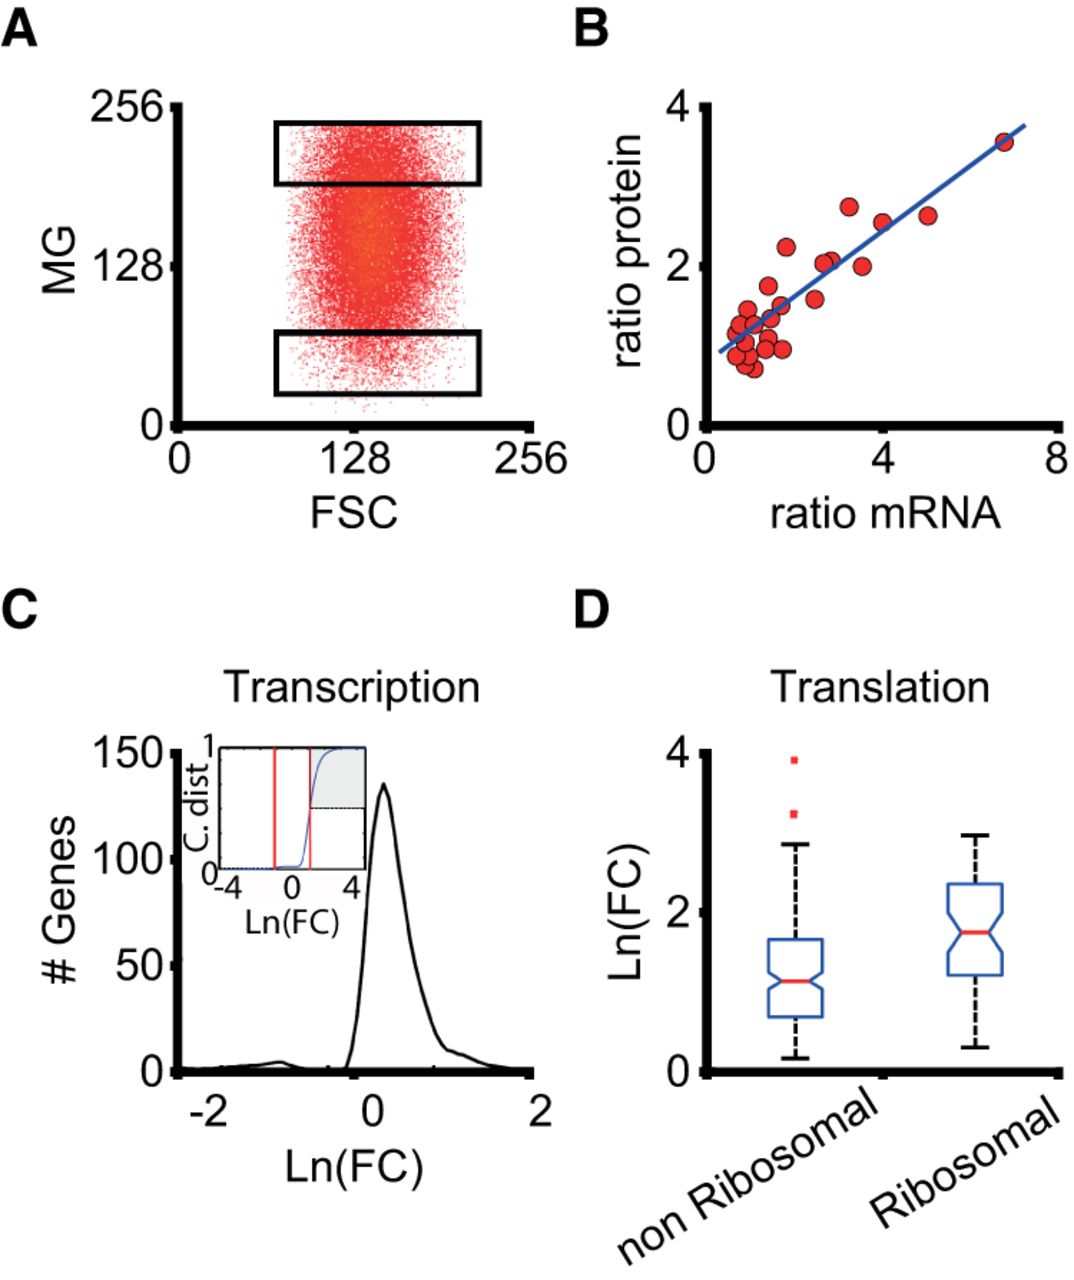
Genome-wide influence of mitochondrial content on gene expression. (A) HeLa cells were sorted according to the mitochondrial content after staining with MitoTracker Green FM. Two populations of cells were split for RNA-seq analysis, with a difference in average mitochondrial content of around fivefold (High and Low regions). (B) Correspondence between mRNA and protein content of 24 selected genes (Methods). The plot of the ratio (High level/Low level) of mRNA from RNA-seq experiments and the cognate protein from inmunostaining assays for equivalent cell populations is shown (correlation: r2= 0.8; slope: 0.36). (C) Distribution of logarithmic fold change (High/Low) ratios for all the genes belonging to the “transcription” family according to the gene ontology classification (Supplemental Table S1). The cumulative distribution (inset) shows that ∼50% of the transcription genes present differences in fold change larger than three (shaded area), which means approximately doubling protein content according to B. There is a small fraction of genes (∼3%) that are down-regulated, showing a threefold decrease in the High condition. (D) Box plot of the distributions of logarithmic fold changes for genes in the “translation” family, separating those coding for ribosomal proteins. These genes are specially affected by mitochondrial content.


