
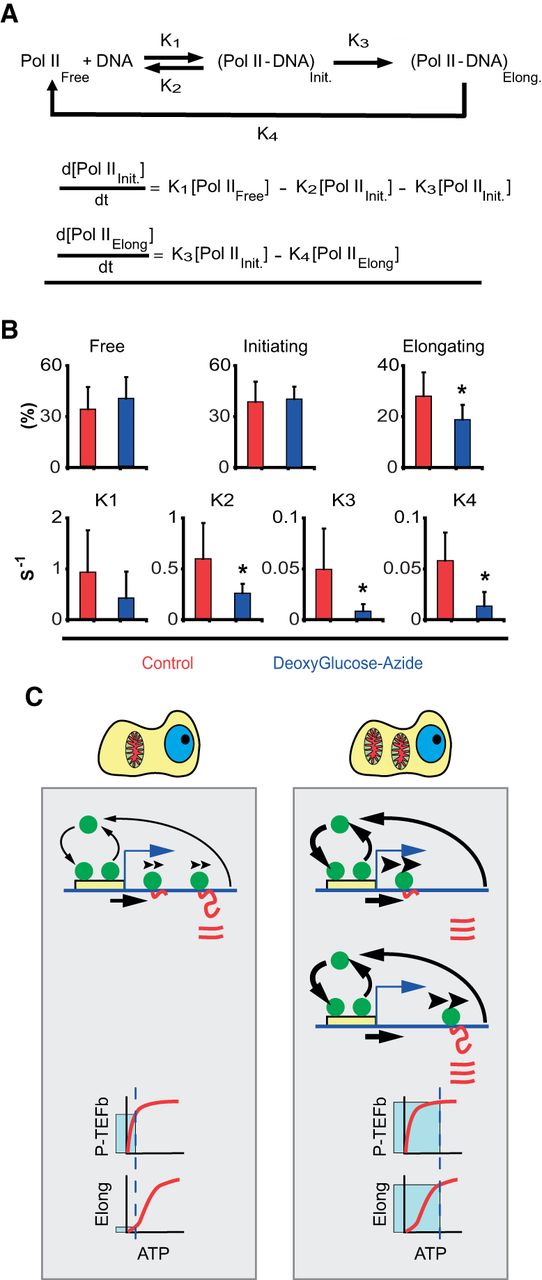
ATP dependence of RNA Pol II transcription kinetics. (A) Kinetic model for RNA Pol II transcription cycle (arrows with rate constants represent transitions) and the corresponding mass-action equations for the amount of initiating and elongating RNA Pol II. (B) Quantification of the fraction of free, initiating and elongating polymerase (first row) and the different rate constants (second row) by FLIP analysis of RNA Pol II-GFP (Supplemental Fig. S4; Supplemental Text). Red bars are values in control cells, and blue bars values in ATP-depleted cells (treated with deoxyglucose and azide). Error bars are SD. For each data point, at least 50 cells were used. (C) Cartoon of the different kinetic modes of RNA Pol II in cells with low (left) and high (right) ATP content. The cartoon exemplifies a typical gene with the promoter (yellow box) and RNA Pol II molecules (green circles), DNA (blue line), and RNA (red line). In cells with low mitochondrial content (left), RNA Pol II binds and detaches continuously at the promoter (arrow thickness illustrates the magnitude of the effect). A fraction of the RNA Pol II molecules are able to commit into elongation (arrow under the DNA). Then elongating RNA Pol II molecules track on the DNA at slow speed (illustrated by the arrowheads over RNA Pol II), which determines the speed of production of RNA (red lines). Once RNA Pol II finish the elongation phase, it detaches from DNA and RNA accumulates. At the bottom of the panel we show the dependency on ATP of the P-TEFb complex (kinase responsible for conversion of RNA Pol II into elongation mode) (hyperbolic kinetics, KM ∼30 μM). “Elong” stands for the elongating phase of RNA Pol II transcription cycle. This phase shows a sigmoidal dependency on ATP with a S0.5 ∼900 μM. Under low mitochondria (low ATP), the process of transition from initiation to elongation works near to full speed, but the speed of elongation is strongly diminished by the low ATP concentration. These two effects result in the accumulation of RNA Pol II molecules in the body of the gene due to the mismatch between entry and exit of RNA Pol II on the gene. In the right panel we illustrate the case of a cell with high mitochondrial mass. In these cells, more genes are active. The dynamic exchange of RNA Pol II molecules on the promoter is not affected: Although K1 and K2 are lower in cells with low mitochondria, the ratio between these constants is maintained (for this reason both arrows are thicker). The fraction of the RNA Pol II molecules that are able to commit to elongation (arrow under the DNA) is higher than in low mitochondria conditions. Then, RNA Pol II molecules elongate at high speed (thick arrowheads over elongating RNA Pol II). Therefore, more RNA molecules are produced per unit of time in high mitochondria conditions. As the speed of elongation is high, the speed of RNA Pol II detachment is higher than in low mitochondrial content cells (thicker arrow). At the bottom of the panel, we explain why the loading of RNA Pol II on DNA is higher in cells with high mitochondrial content. Under high ATP conditions, the complex P-TEFb is working at full speed and likewise the elongation phase of the transcription cycle. As both kinetic processes are balanced, the entry and exit of RNA Pol II on the gene are also balanced.


