
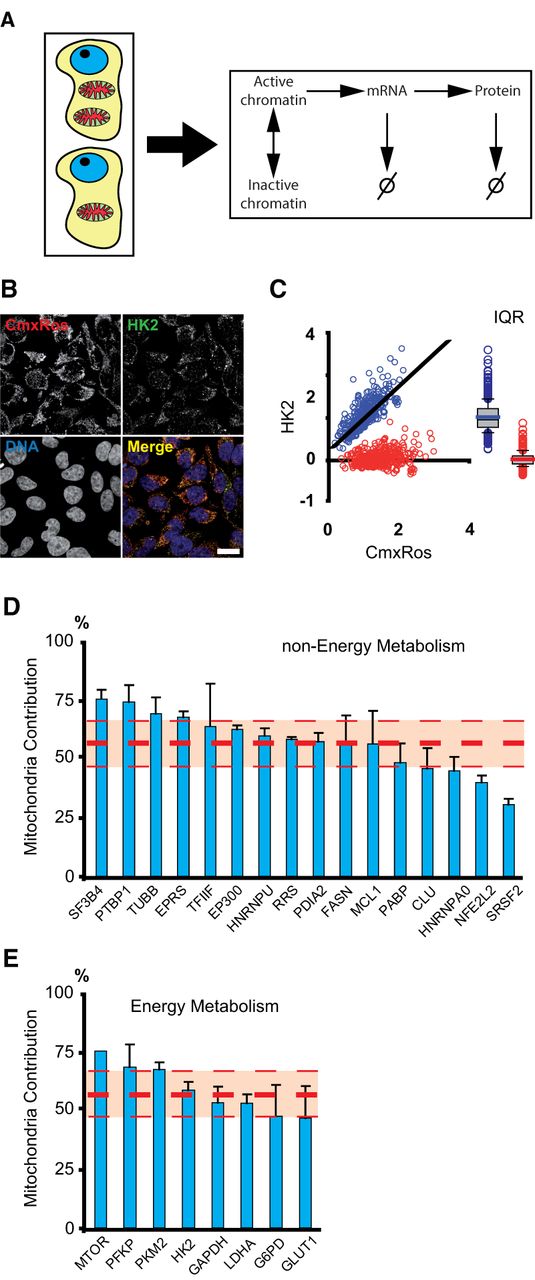
Mitochondrial contribution to protein variability. (A) Differences in the mitochondrial content of isogenic cells can act as a global factor generating variability in all steps of gene expression (chromatin remodeling, transcription, and translation) as well as affecting mRNA and protein stabilities. (B) Mitochondrial content (CMXRos) and protein levels (the enzyme Hexokinase 2 is shown here) are simultaneously quantified in single cells by fluorescence microscopy. (C) Dependence of HK2 protein levels as a function of mitochondrial content in a population of clonal cells (blue dots, r2= 0.62). CMXRos and protein values are normalized by their average levels. We decorrelate protein levels from mitochondria by rotating the distribution around the best-fit line (red dots). The box plots of both distributions are shown on the right. From the ratio of interquartile ranges (IQR) of the normal and detrended distributions, we can calculate the mitochondrial contribution to protein variability in the population. (D) Mitochondrial contribution to global variability (MCV) in protein levels from 16 housekeeping genes, none related to energy metabolism. (E) MCV in protein content from eight genes involved in energy metabolism. The thick red dashed line is the average contribution of all proteins. Thin lines are standard deviations. Error bars are standard deviations of three independent biological replicates (with 200–400 cells per experiment).


