
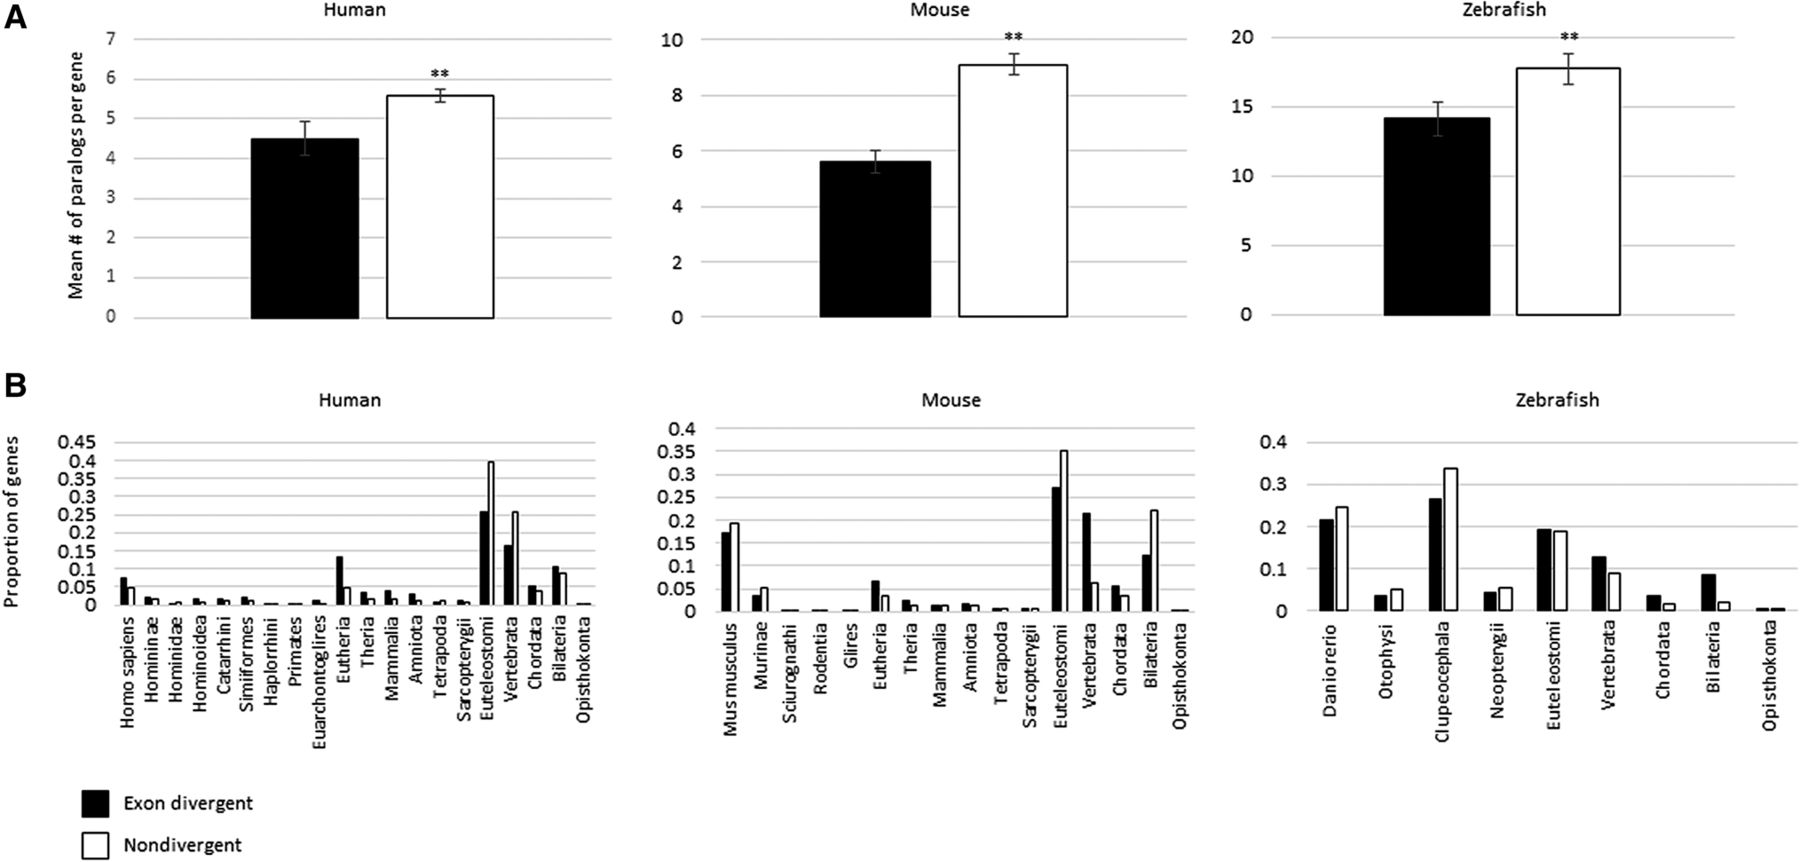
Family size and duplication age do not explain the reduction in alternative splicing. (A) Histograms comparing gene family size between exon divergent and nondivergent paralogs. In each species the nondivergent paralogs have larger mean family sizes. Student's t-test was used to calculate the significance of the differences in mean number of paralogs. The asterisks indicate the significance of the difference as compared to exon divergent paralogs: (**) P < 0.01. Error bars, SEM. (B) Histograms showing the proportion of all exon divergent paralogs (black) created at each evolutionary epoch in each species. These values are compared against the proportion of nondivergent paralogs (white) produced at each epoch within each species. (Note, for each species the black bars sum to one, as do the white bars.) Duplicate age increases along the x-axis (not to scale). These indicate that the exon divergent paralogs are not consistently enriched in young duplicates and that time since duplication is not a confounding effect.


