
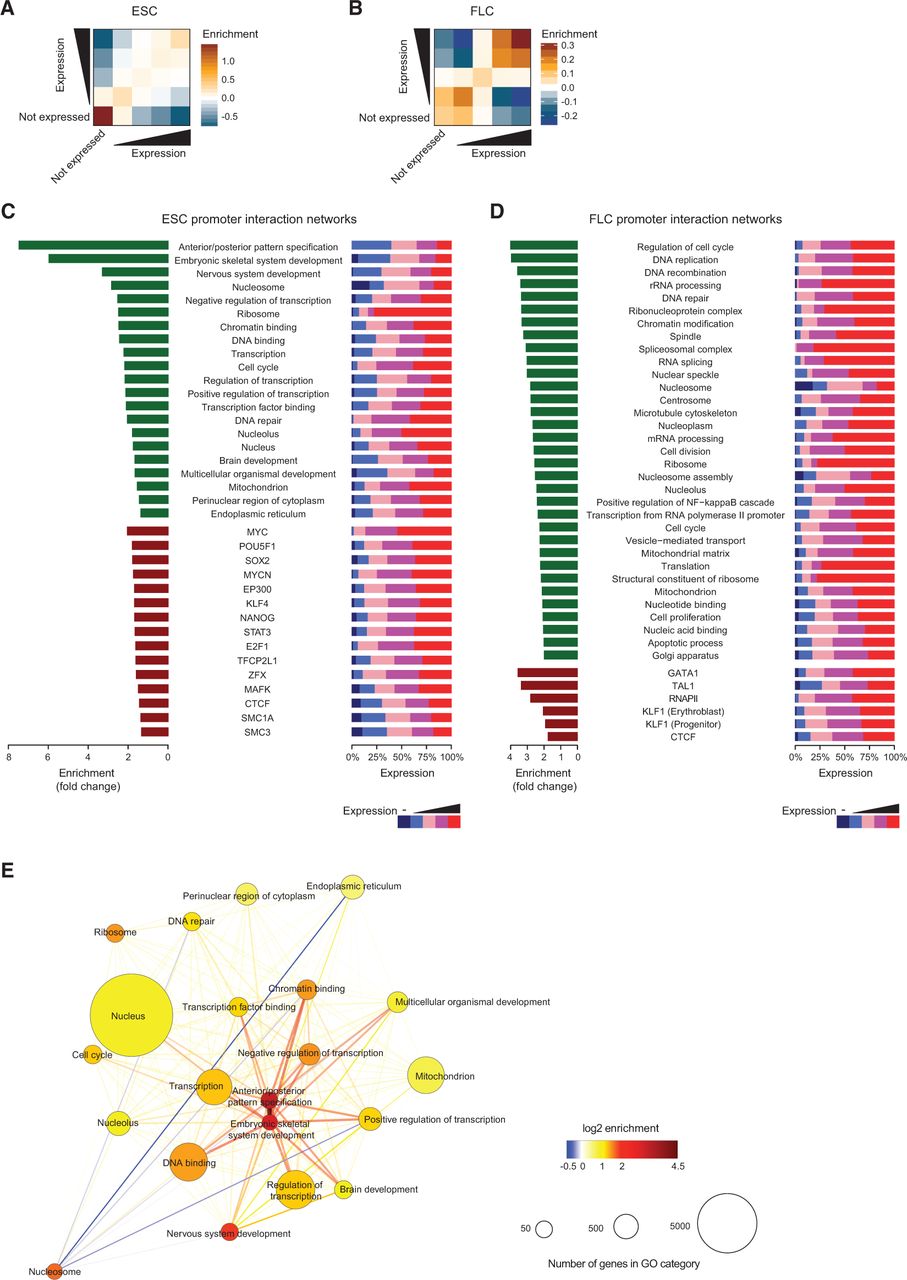
Promoter–promoter interaction networks. (A,B) Enrichment of interactions between promoters from different expression categories in ESCs (A) and FLCs (B). (C) ESC promoter–promoter interaction networks. (Left) Fold enrichment of GO categories (green bars) and promoters bound by trans-acting factors (dark red bars) in ESC promoter interaction networks. (Right) Distribution of expression categories within the respective ESC promoter interaction networks. (D) FLC promoter–promoter interaction networks. (Left) Fold enrichment of GO categories (green bars) and promoters bound by trans-acting factors (dark red bars) in FLC promoter interaction networks. (Right) Distribution of expression categories within the respective FLC promoter interaction networks. (E) Connectivity between ESC promoter–promoter subnetworks categorized based on gene ontology. Circle sizes represent the numbers of genes within the respective promoter subnetwork. Color of circles represents the fold enrichment of connectivity between the members, whereas edge colors show the enrichment of connectivity between the subnetworks.


