
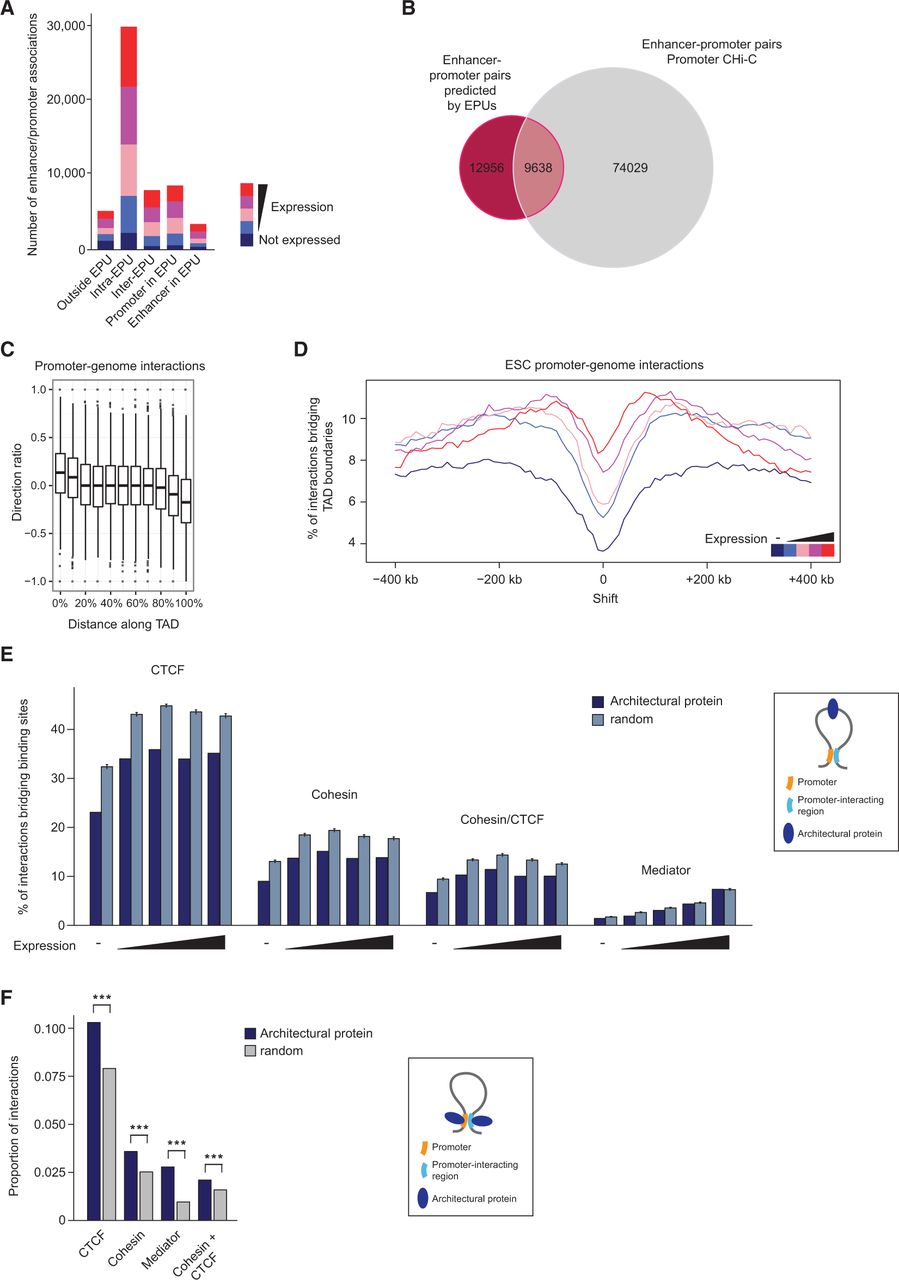
Demarcation of promoter interactions. (A) Number of interactions between promoters and enhancer elements with regard to the genomic position of enhancer promoter units (EPUs) (Shen et al. 2012) in ESCs, separated by expression categories. (B) Number of promoter–enhancer pairs predicted by EPUs (Shen et al. 2012) and promoter CHi-C. (C) Directionality of promoter–genome interactions in ESCs, relative to TAD boundaries. (D) Percentage of promoter–genome interactions bridging TAD boundaries, separated by expression categories. TAD boundary positions are set at zero and are then shifted artificially in 10-kb steps upstream and downstream. (E) Percentage of promoter interactions bridging binding sites of CTCF, cohesin (SMC1A), Mediator (MED12), and sites co-occupied by CTCF and cohesin in ESCs (as illustrated by schematic on the right) compared to randomized control sites. (F) Proportion of interactions in which the promoter and the interacting fragments are bound by the indicated proteins (CTCF, cohesin [SMC1A], Mediator [MED12], or CTCF and cohesin) in ESCs (as illustrated by schematic on the right), compared to randomized control sites.


