
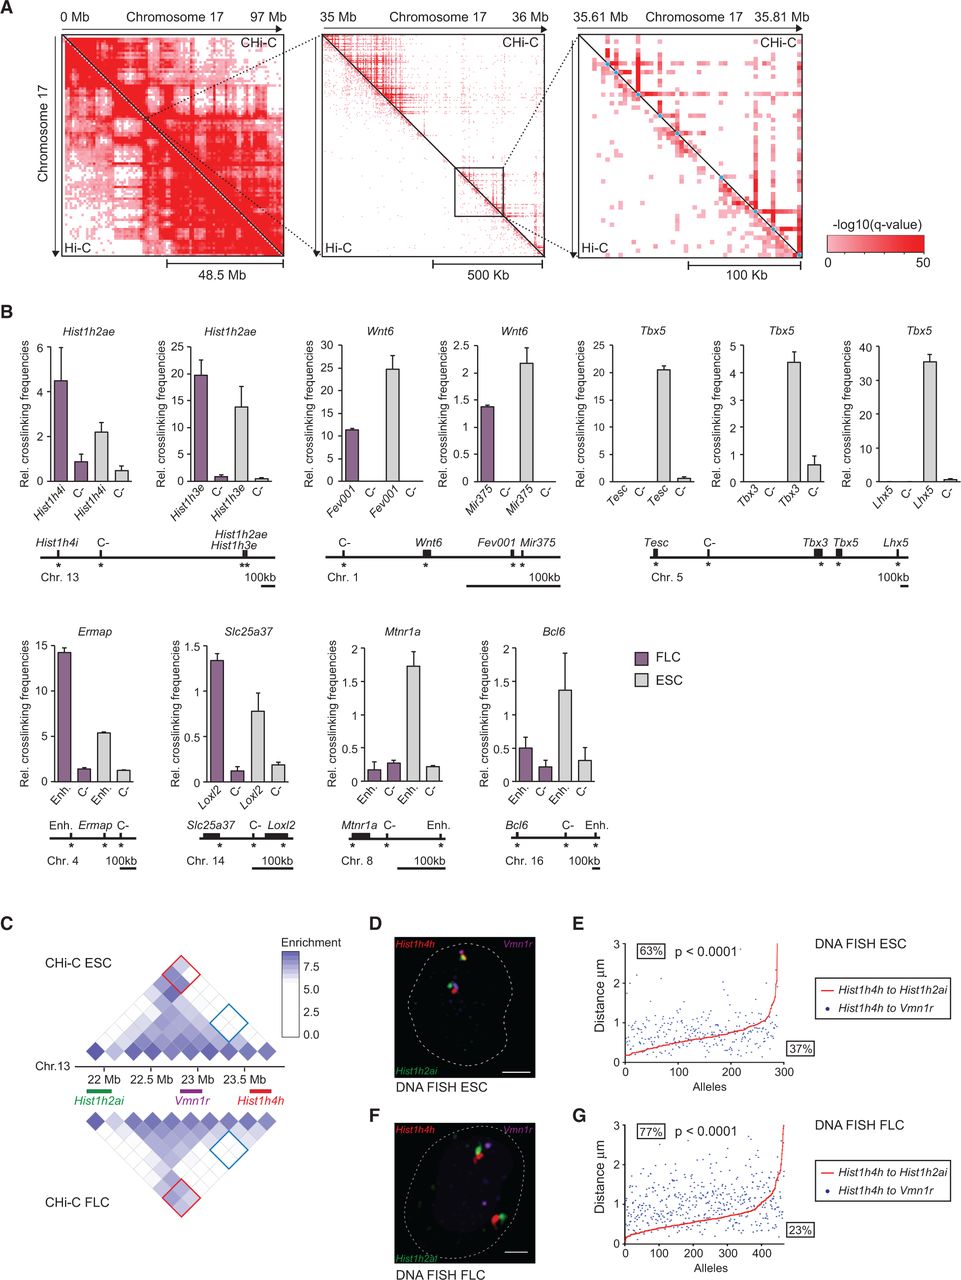
Validation of promoter interactions. (A) Hi-C and promoter CHi-C contact maps after GOTHiC filtering for significant interactions: whole chromosome view of mouse Chromosome 17 (left), and 1-Mb (middle) and 200-kb subregions (right) encompassing the Pou5f1 gene locus. Individual promoter bait restriction fragments are marked by light blue dots in the right panel. Color intensity corresponds to the significance of the interaction, −log10(q-value) from GOTHiC. (B) Validation of CHi-C results by 3C-qPCR. Graphs showing the relative crosslinking frequencies of promoter restriction fragments (top) with another promoter, putative enhancer (Enh) or control, noninteracting fragments (C-), as depicted in the graphs and the maps below. Interactions identified by promoter CHi-C present in both cell types (Hist1h2ae), preferential in ESCs (Wnt6, Tbx5, Mtnr1a, Bcl6), or preferential in FLCs (Ermap, Slc25a37) are shown. Control fragments (C-) were identified as noninteracting, or interacting at lower frequencies by CHi-C, compared to the interacting fragments in the respective cell type. Asterisks denote the position of the primers used in 3C-qPCR. (C–G) Validation of CHi-C results by triple-label 3D DNA FISH. (C) Promoter CHi-C contact maps for a ∼2-Mb region on mouse Chromosome 13 in ESCs (top) and FLCs (below), encompassing the Hist1h2ai, Vmn1r, and Hist1h4h loci as shown. Contact enrichment between Hist1h4h and Vmn1r loci are marked by blue squares on the contact maps, and contact enrichment between Hist1h4h and Hist1h2ai are marked by red squares. (D) and (F) Representative triple-label 3D DNA FISH in ESCs (D) and FLCs (F), DNA FISH signals for the Hist1h2ai locus (green), the Vmn1r locus (purple), and the Hist1h4h locus (red). Scale bar, 2 μm. (E) and (G) Interprobe distance measurements of triple-label 3D DNA FISH in ESCs (E) and FLCs (G). Shown are the ranked interprobe distances between Hist1h4h and Hist1h2ai (red line) with the corresponding interprobe distance between Hist1h4h and Vmn1r (blue dots) per allele. Percentages above the red line indicate the frequency at which the distance between Vmn1r and Hist1h4h is greater than the distance between Hist1h2ai and Hist1h4h, whereas percentages below the line indicate the frequency at which the distance between Vmn1r and Hist1h4h is less than the distance between Hist1h2ai and Hist1h4h. P-values: χ2 test comparing the distance distributions between Vmn1r and Hist1h4h to the distance between Hist1h2ai and Hist1h4h.


