
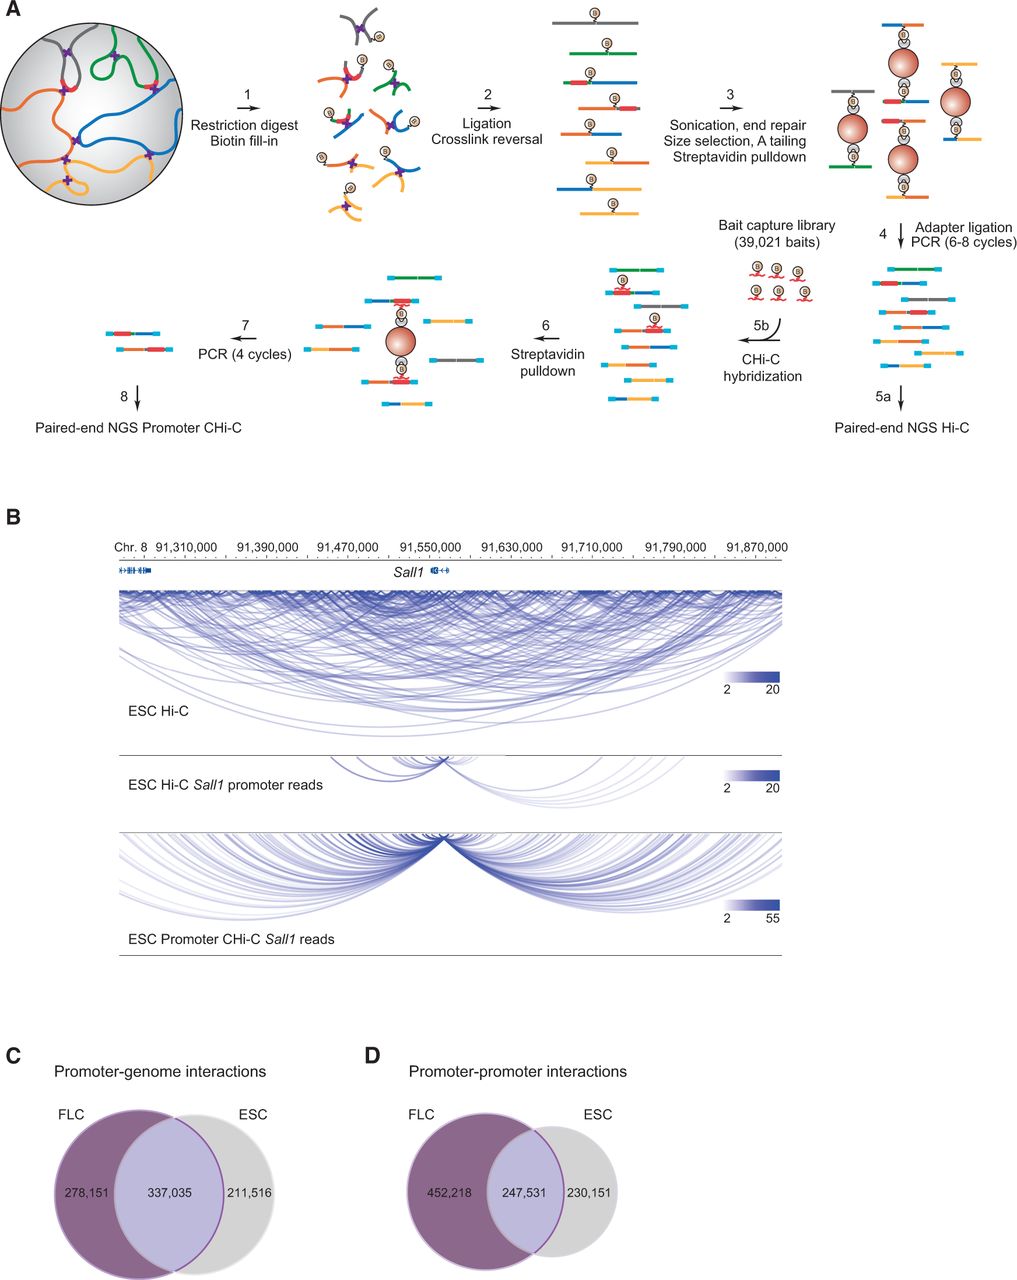
Promoter capture Hi-C. (A) Experimental strategy: Hi-C libraries were either directly interrogated by massively parallel paired-end sequencing (step 5a) or subjected to promoter CHi-C (steps 5b–8). For promoter CHi-C, the Hi-C library is hybridized to the RNA capture library (“bait”) in solution, followed by streptavidin pulldown of Hi-C library ligation products containing promoters targeted by the biotin-RNA baits (22,225 promoters in the mouse genome). The resulting promoter CHi-C library is analyzed by massively parallel paired-end sequencing. Chromosomal regions are depicted in blue, green, gray, orange, and yellow; promoters are depicted in red; and sequencing adapters in light blue. Biotin moieties are symbolized by an encircled “B,” and formaldehyde crosslinks are represented by purple crosses. RNA bait molecules are represented by red fragments connected to a biotin moiety. (B) The chromosomal interactome of the Sall1 locus in ESCs. Shown are unfiltered read pairs from Hi-C data for a 0.6-Mb region containing the Sall1 gene (top), Sall1 promoter-contacting read pairs from the same Hi-C data (middle), and Sall1 promoter-contacting read pairs from promoter CHi-C (lower). Hi-C and CHi-C data sets were adjusted to the same number of overall sequence reads. Interactions are displayed using the WashU EpiGenome Browser (Zhou et al. 2013). (C) Unique and shared promoter–genome significant interactions after GOTHiC filtering in ESCs and FLCs. (D) Unique and shared promoter–promoter significant interactions after GOTHiC filtering in ESCs and FLCs.


