
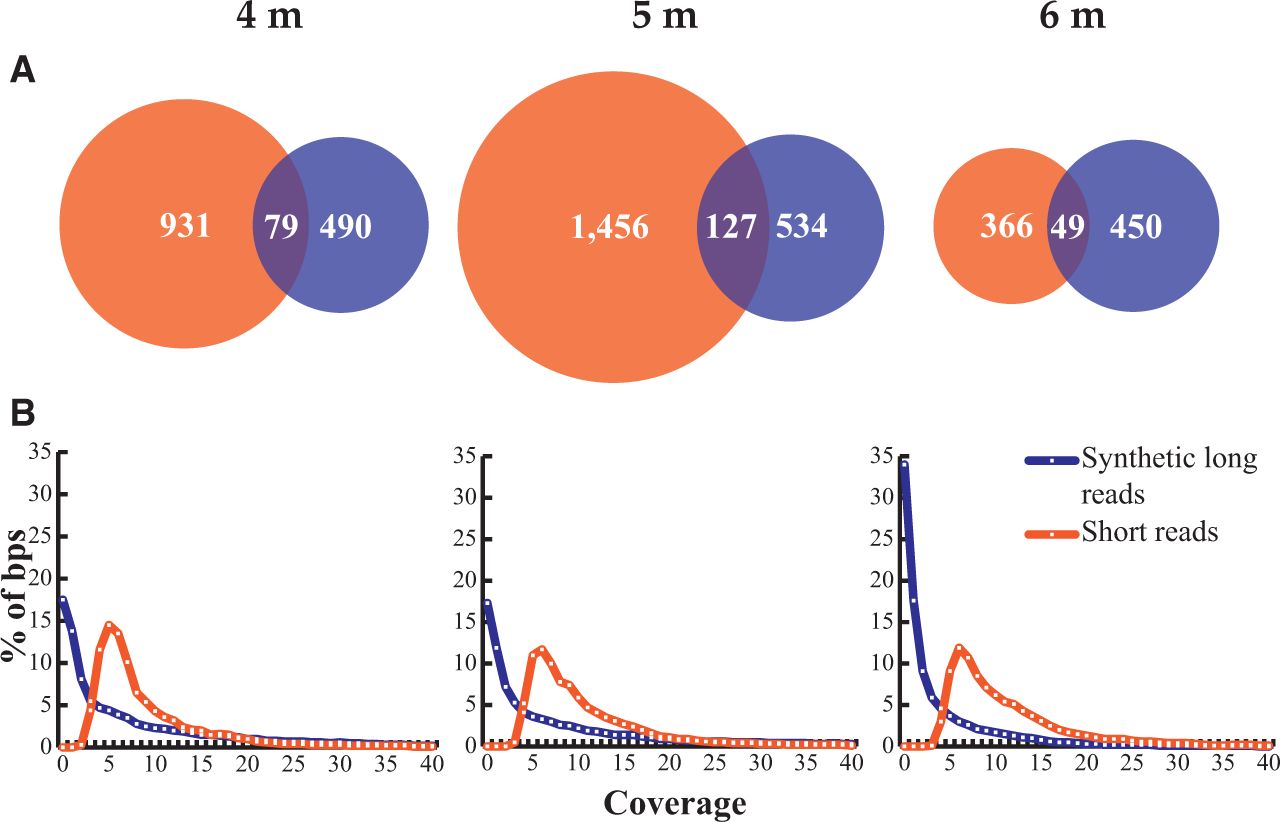
Figure 1.
(A) Overlap between short-read assembled scaffolds (orange) and synthetic long reads (blue). Numbers are in Mbp and were calculated based on all overlapping regions longer than 1000 bp aligning at 98% identity or more. (B) Coverage distribution of synthetic long reads and short-read assembled scaffolds. Coverage was computed by mapping the short reads from the same data set.


