
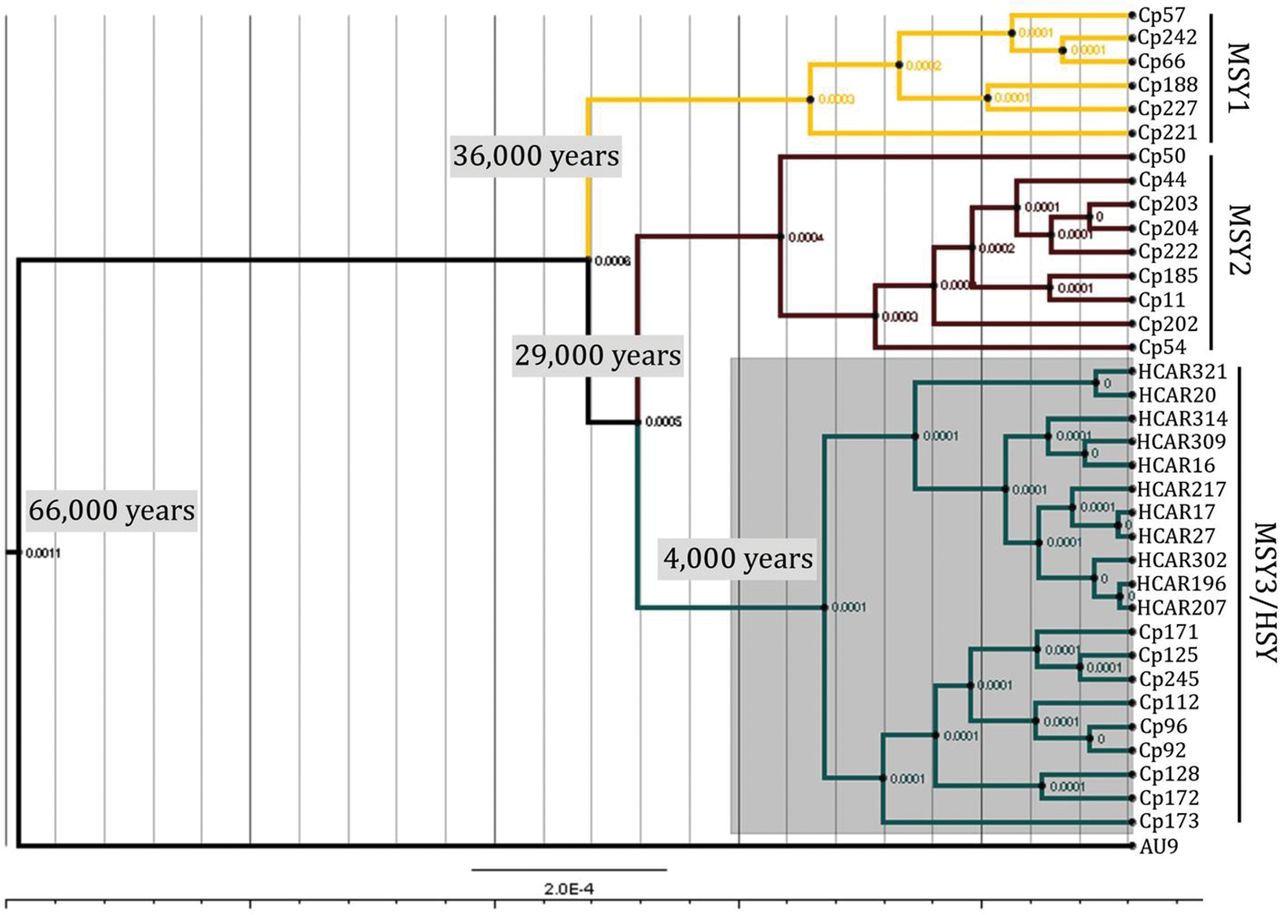
Figure 5.
Bayesian analysis of Y chromosome divergence times. The MSY1 haplotype subgroup is shown in yellow, MSY2 in brown, and MSY3/HSY in blue. The “AU9” MSY forms an outgroup (in black) to the three populations from Costa Rica. The MYS3/HSY subgroup split is highlighted in gray. Node lengths represent estimated synonymous substitutions per site, which were used with a corrected molecular clock (see Methods) to estimate the divergence times.


