
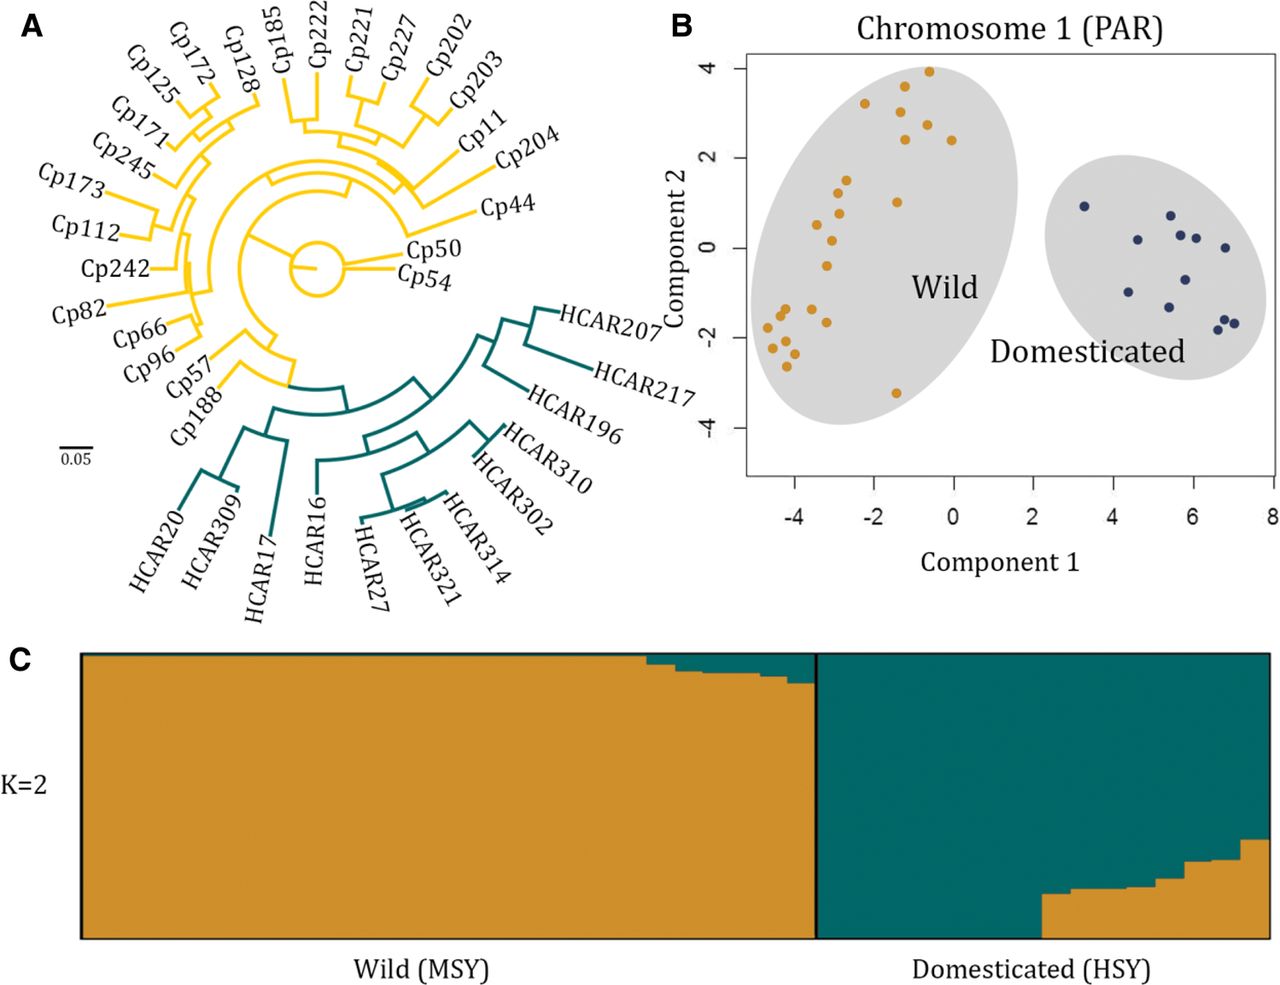
Figure 4.
Population structure of the papaya PAR. (A) Maximum likelihood phylogenetic tree based on the 193,621 Chromosome 1 SNPs. Domesticated (hermaphrodite) varieties are shown in blue and wild (male) accessions are shown in yellow. (B) PCA based on all Chromosome 1 (PAR) SNPs and indels. The two distinct clusters, of sequences from males and hermaphrodites, are shaded in gray. (C) Population structure analysis using STRUCTURE (Falush et al. 2003). Each accession is represented by a vertical bar, and the length of each colored segment represents the contribution of each subgroup.


