
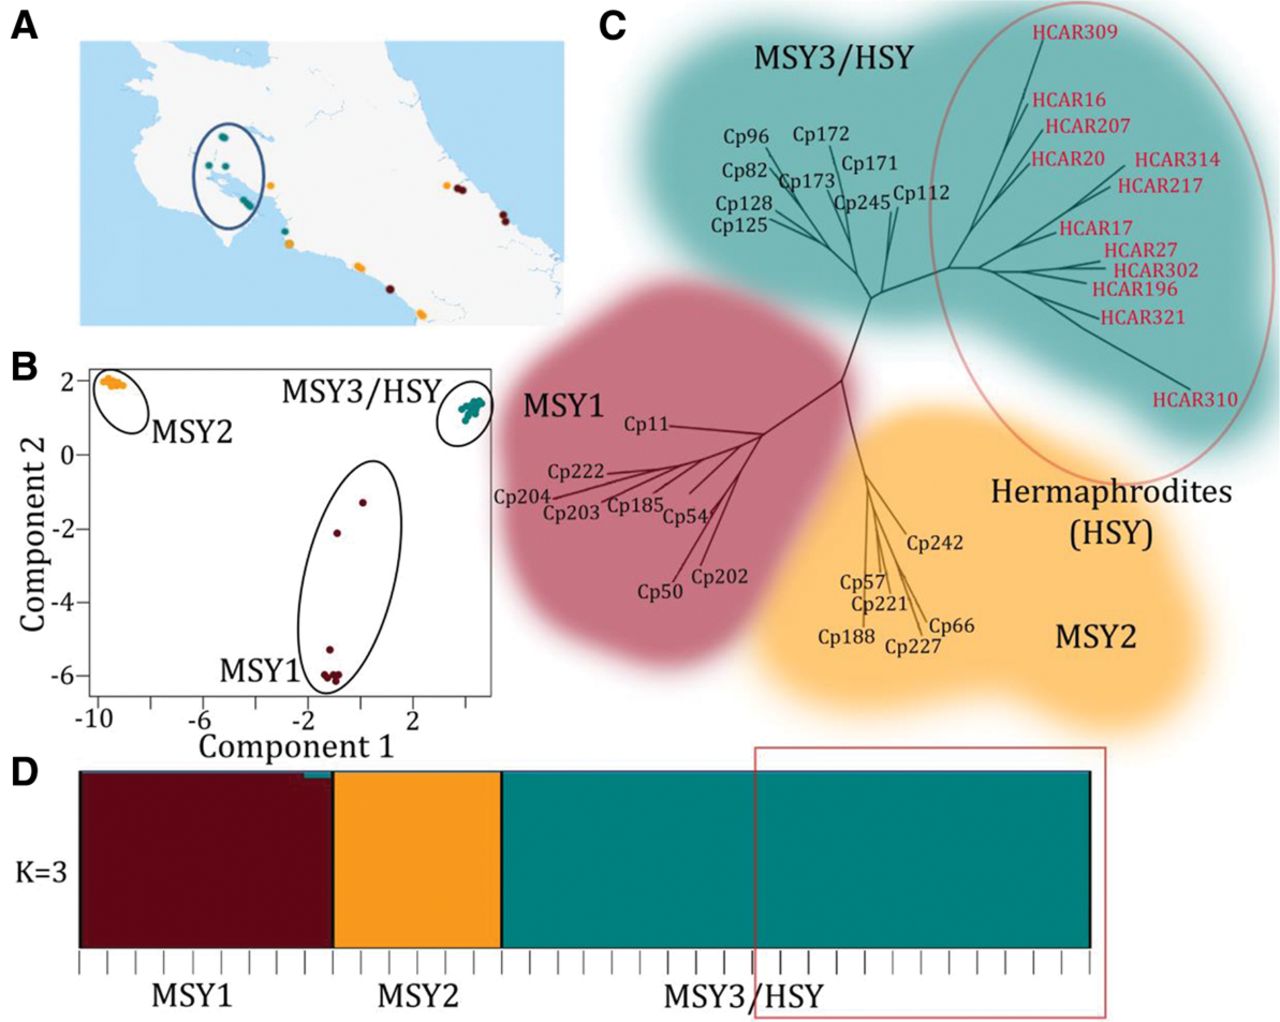
Population structure of the papaya Y chromosomes. (A) Geographic distribution of the wild papaya populations sampled in Costa Rica. Populations with the MSY1 haplotype are shown in brown; those with MSY2 in orange. Populations with MSY3 haplotypes (from which the HSY haplotype evolved) are in blue and circled. All these wild accessions have GPS coordinates, but some individuals were close together and have overlapping GPS coordinates, so that the figure has fewer sites than sampled individuals. (B) Principal component analysis (PCA) based on all 58,000 Y-specific SNPs and indels. The MSY3/HSY and MSY2 clusters each corresponds to narrow geographic distributions, while populations with MSY1 are more widely distributed. Circles signify statistically different clusters. (C) Maximum likelihood phylogenetic tree based on the 58,000 Y chromosome SNPs. Wild accessions are labeled Cp, and the domesticated varieties are labeled HCAR and are circled in red. (D) Population structure analysis using STRUCTURE (Falush et al. 2003). Each accession is represented by a vertical bar, and the lengths of the colored segments represent the contribution of each subgroup. The STRUCTURE statistics are listed in Supplemental Table 7. Domesticated varieties are outlined in red.


