
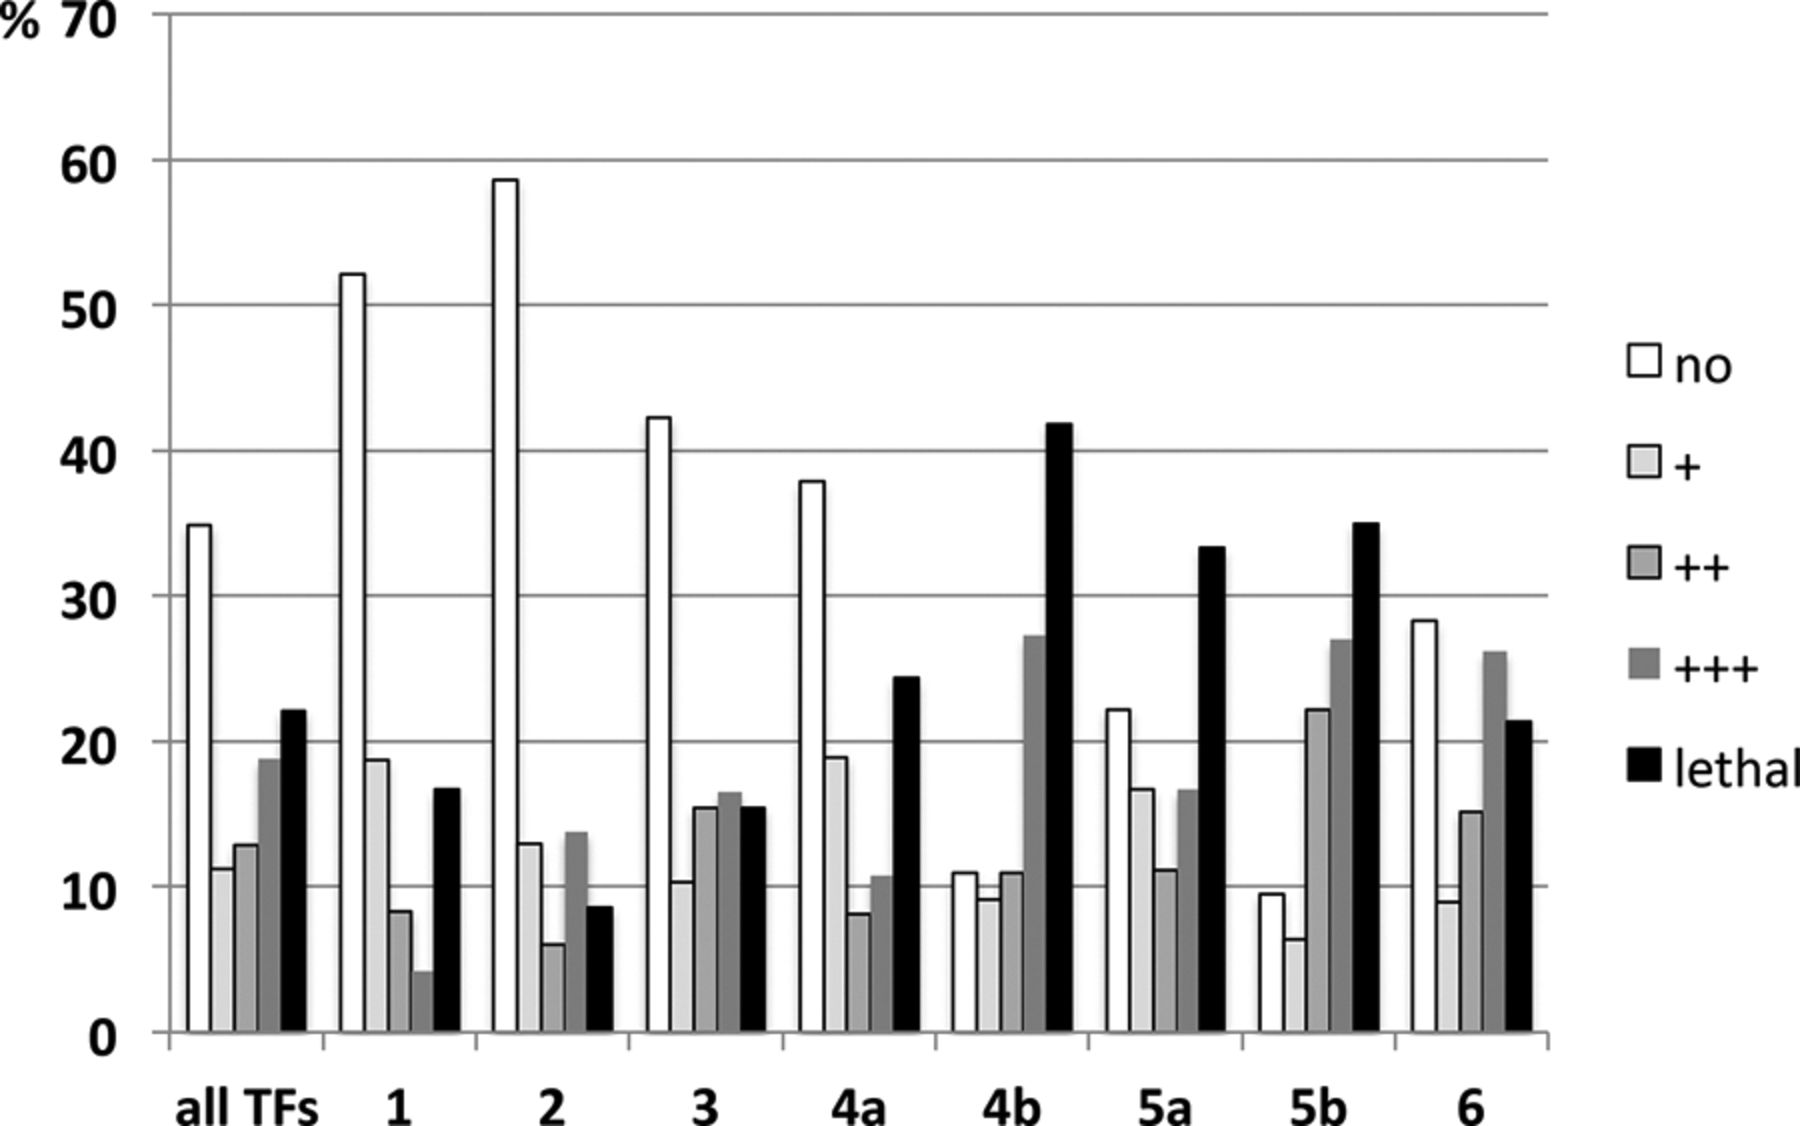
Figure 4.
Distribution of phenotypes induced by TFs in the different clusters. The chart illustrates the distribution of phenotypes caused by misexpression of all TFs and from each cluster (c1–c6, x-axis) by MS1096-Gal4 in the wing.


