
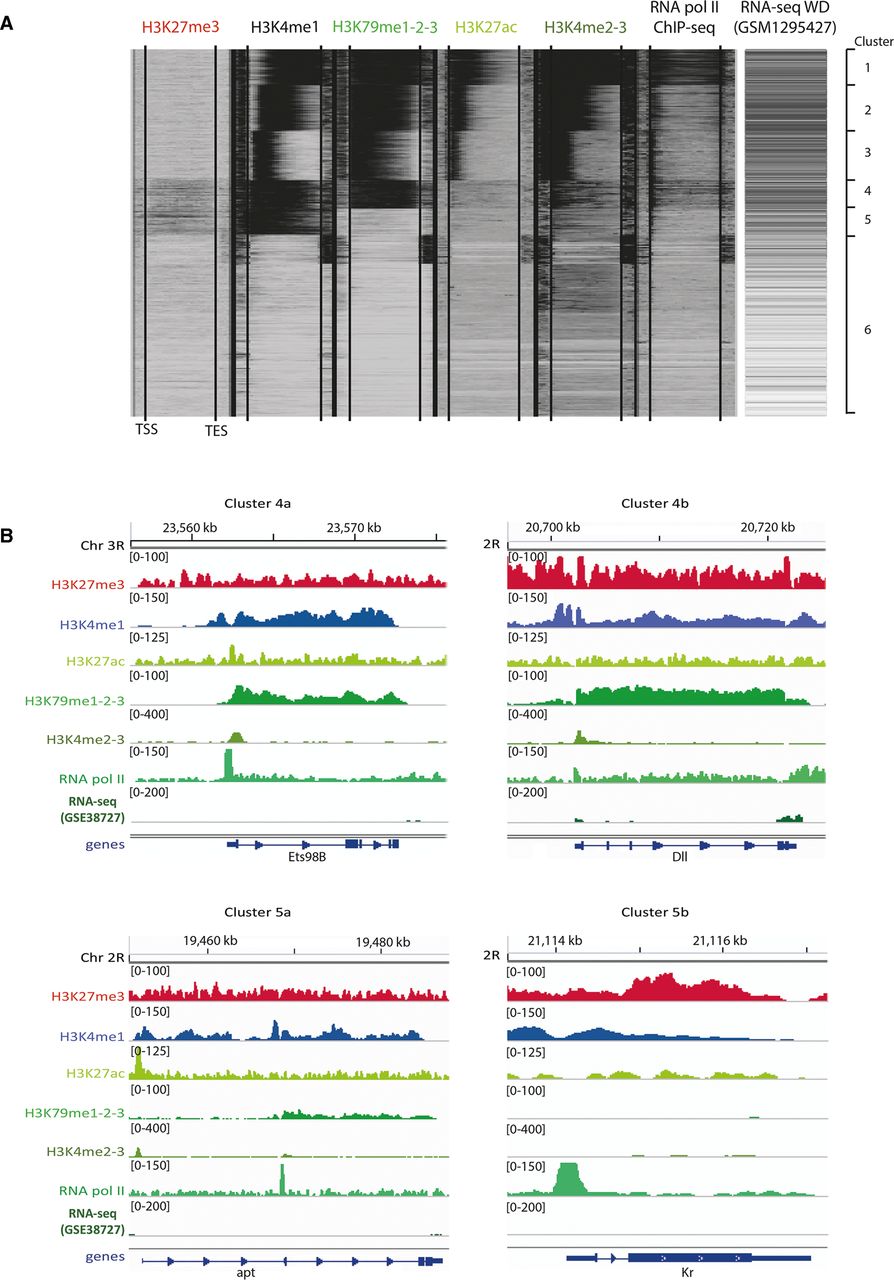
The chromatin landscape of wing discs at the third instar larval stage. (A) Clustering of all detected genes according to the distribution of five histone marks and RNA Pol II as measured by ChIP-seq. Activating marks are indicated in green, repressive marks in red. The locations of the transcription start sites (TSSs) and the transcription end sites (TESs) are indicated by lines within each histone modification column. Previously published wing disc RNA-seq data (McKay and Lieb 2013) are also presented to directly link histone modification, RNA Pol II enrichment, and gene expression. (B) Representative examples for genes in clusters 4a, 4b, 5a, and 5b are shown (“a” reflects genes with low H3K27me3 enrichment, while genes in “b” reflect high enrichment of this mark). Gene loci are indicated at the bottom of the panels and the cluster number is listed at the top of the panels. The same molecular marks as in A are displayed. The scale for all tracks represents the tag depth per base pair, except for the RNA-seq data, for which the log2 of (FPKM + 1) is plotted.


