
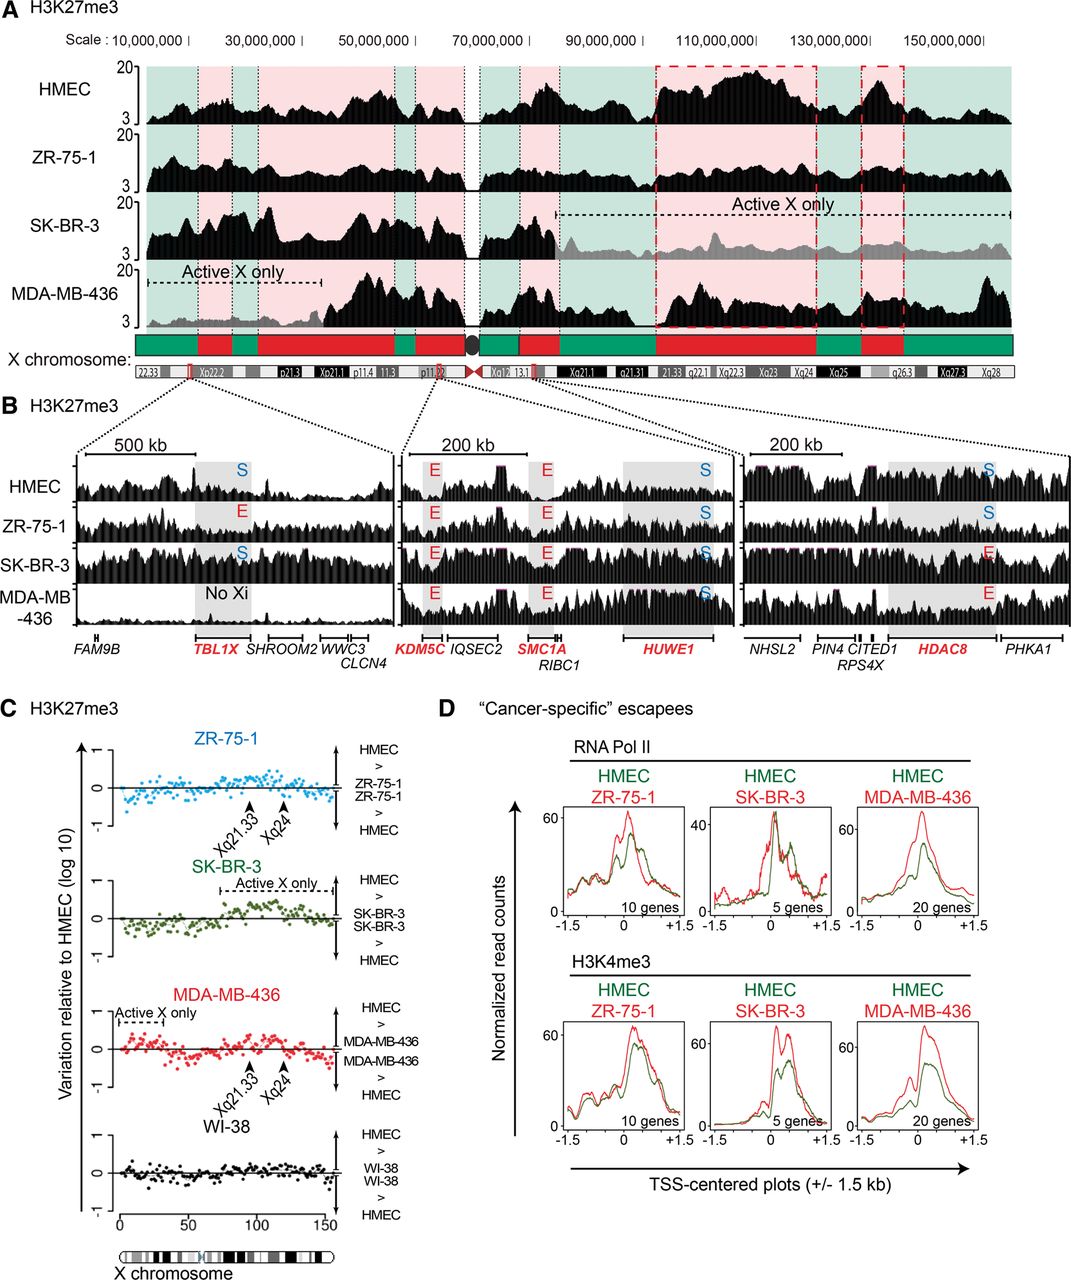
Chromatin landscape of the inactive X chromosome is disrupted in breast cancer cell lines. (A) Scheme of H3K27me3 enrichment (ChIP-seq) across the whole X chromosome. Red and green domains represent H3K27me3 and H3K9me3 enriched regions, respectively, as identified in normal human cells (Chadwick 2007). Regional loss of inactive X is indicated (and depicted by gray region). The two main enriched H3K27me3 domains’ loss in ZR-75-1 and MDA-MB-436 are depicted by the two red dotted rectangles. (B) H3K27me3 enrichment is detailed for three regions of the X chromosome carrying genes subjected (S) or escaping XCI (E). (C) Dot plots show variation of H3K27me3 enrichment along the X chromosome (1-Mb bins) of the three tumoral cell lines and WI-38 relative to HMEC. (D) TSS-centered plots (±1.5 kb) show RNA Pol II and H3K4me3 enrichment for the “cancer-specific” escapees (cf. Supplemental Table S1) of each tumoral cell line (red line) and HMEC (green line). The number of genes analyzed is indicated below each plot.


