
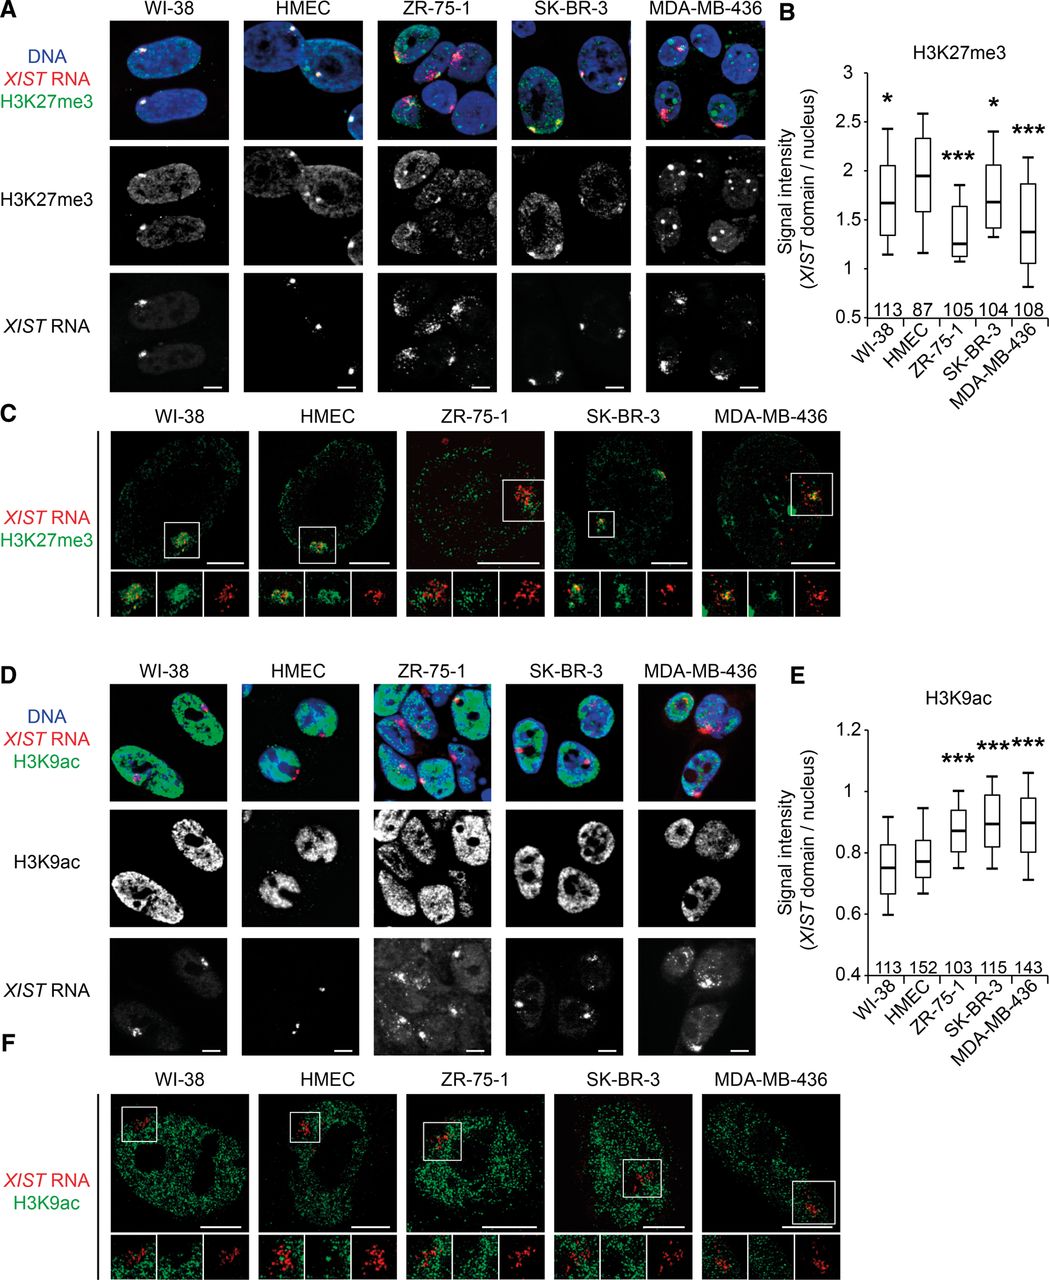
H3K27me3 and H3K9ac profiles associated with XIST-coated X chromosomes are impaired in breast cancer cell lines. (A) Z-projections of 3D immuno-RNA FISH show representative examples of the level of H3K27me3 enrichment (green) on XIST RNA domains (red) in normal (WI-38 and HMEC) and breast cancer cell lines (ZR-75-1, SK-BR-3, and MDA-MB-436). NB: In MDA-MB-436, the highly H3K27me3 enriched bodies visible in each nucleus do not belong to the X chromosome (nor in metaphase [Fig. 3C] or in interphase [Supplemental Fig. S3F]). (B) Boxplot shows the levels of H3K27me3 enrichment on XIST domains relative to the rest of the nucleus. Numbers of analyzed nuclei are shown above the x-axis. For details on quantification method see Supplemental Figure S2A,B. (C) High-resolution immuno-RNA FISH shows representative examples of H3K27me3 enrichment (green) on XIST RNA domains (red) in normal and breast cancer cell lines. Insets for H3K27me3, XIST RNA, and merge are shown below each cell line. (D) Single section of 3D immuno-RNA FISH shows representative examples of the level of H3K9ac depletion (green) on XIST RNA domains (red) in normal and breast cancer cell lines. (E) Boxplot shows the levels of H3K9ac depletion on XIST domains relative to the rest of the nucleus. The numbers of analyzed nuclei are shown above the x-axis. For details on the quantification method, see Supplemental Figure S2A,C. (F) High-resolution immuno-RNA FISH shows representative examples of H3K9ac depletion (green) on XIST RNA domains (red) in normal and breast cancer cell lines. Insets for H3K9ac, XIST RNA, and merge are shown below each cell line. (Boxplots) Upper whisker represents 90%, upper quartile 75%, median 50%, lower quartile 25%, and lower whisker 10% of the data set for each cell line. (***) P < 0.001; (**) P < 0.01; (*) P < 0.05 using the Student's t-test. All data sets are compared with HMEC data set. Scale bar, 5 µm.


