
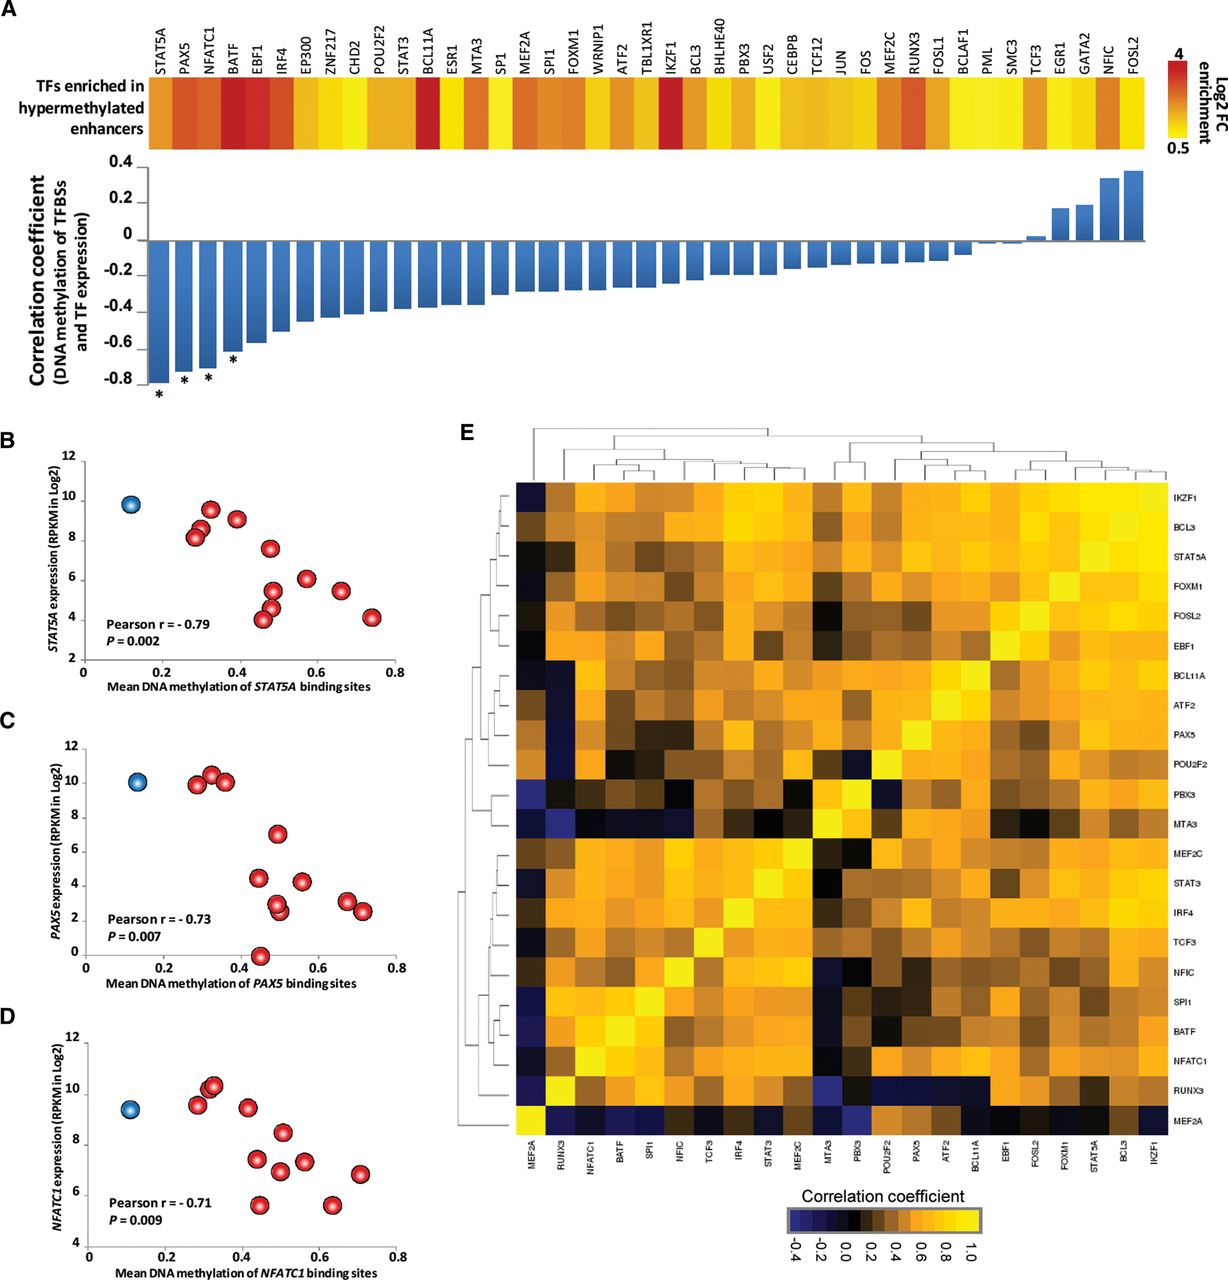
B cell-specific TFs' expression correlates with DNA methylation levels of their binding sites in MM. (A) The upper part shows that hypermethylated enhancers are enriched for binding sites of B cell-specific TFs. The lower part displays the correlation coefficients between TF expression and mean DNA methylation level of their respective binding sites with hypermethylation in MM. (*) P < 0.05. (B–D) Scatter plots showing the association between TF expression and mean methylation level of their respective binding sites. Normal plasma cells are shown in blue and multiple myeloma samples are depicted in red. (E) Correlation matrix of expression levels of TFs among the 11 MM cases with available RNA-seq data. Only those TFs from A with at least 1.5-fold enrichment (in log2) were used for this analysis.


