
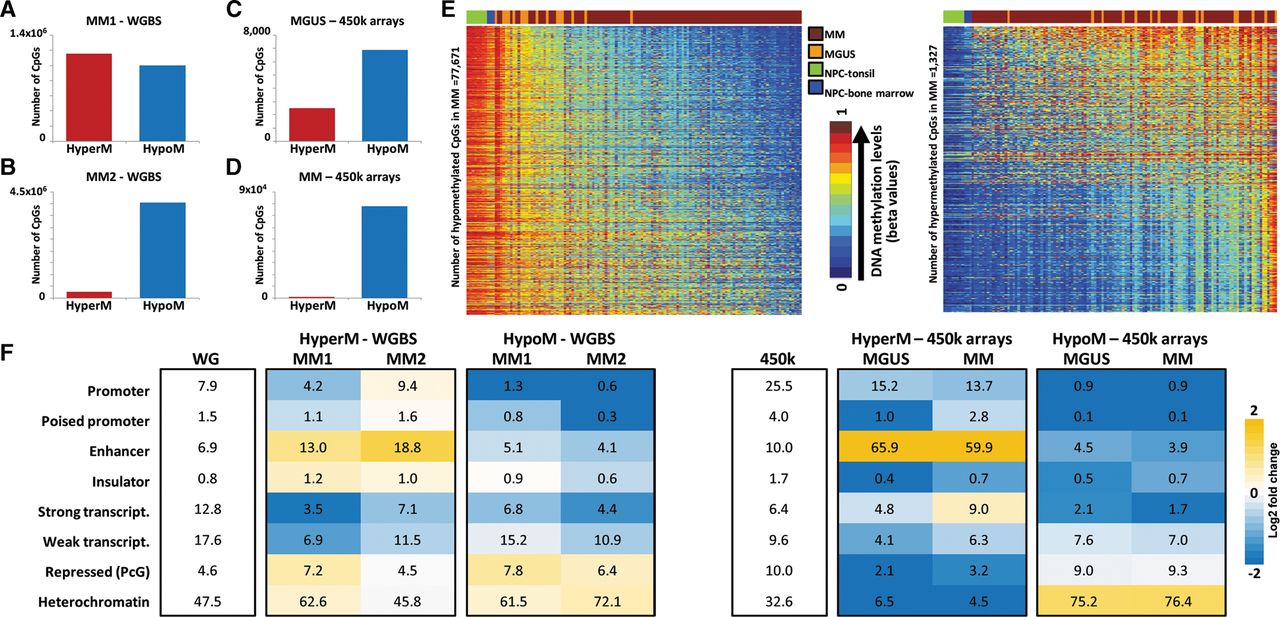
Differential DNA methylation in MM and MGUS as compared to NPCs. (A,B) Differentially methylated CpGs using WGBS data in (A) MM1 versus NPC and (B) MM2 versus NPC. (C,D) Differentially methylated CpGs identified using the HumanMethylation450 BeadChip data in (C) MGUS versus NPC samples and (D) MM versus NPC samples. (E) Heatmap of significantly hypomethylated (left) or hypermethylated CpGs (right) in MM samples versus NPC samples. (F) Relative distribution of differentially hypo- or hypermethylated CpGs across different functional chromatin states of the genome using WGBS data (left) or HumanMethylation450 BeadChip data (right) as compared to their respective backgrounds (first column). The numbers inside each cell point to the percentage of CpGs belonging to a particular chromatin state. (WG) Whole-genome; (HyperM) hypermethylated CpGs; (HypoM) hypomethylated CpGs.


