
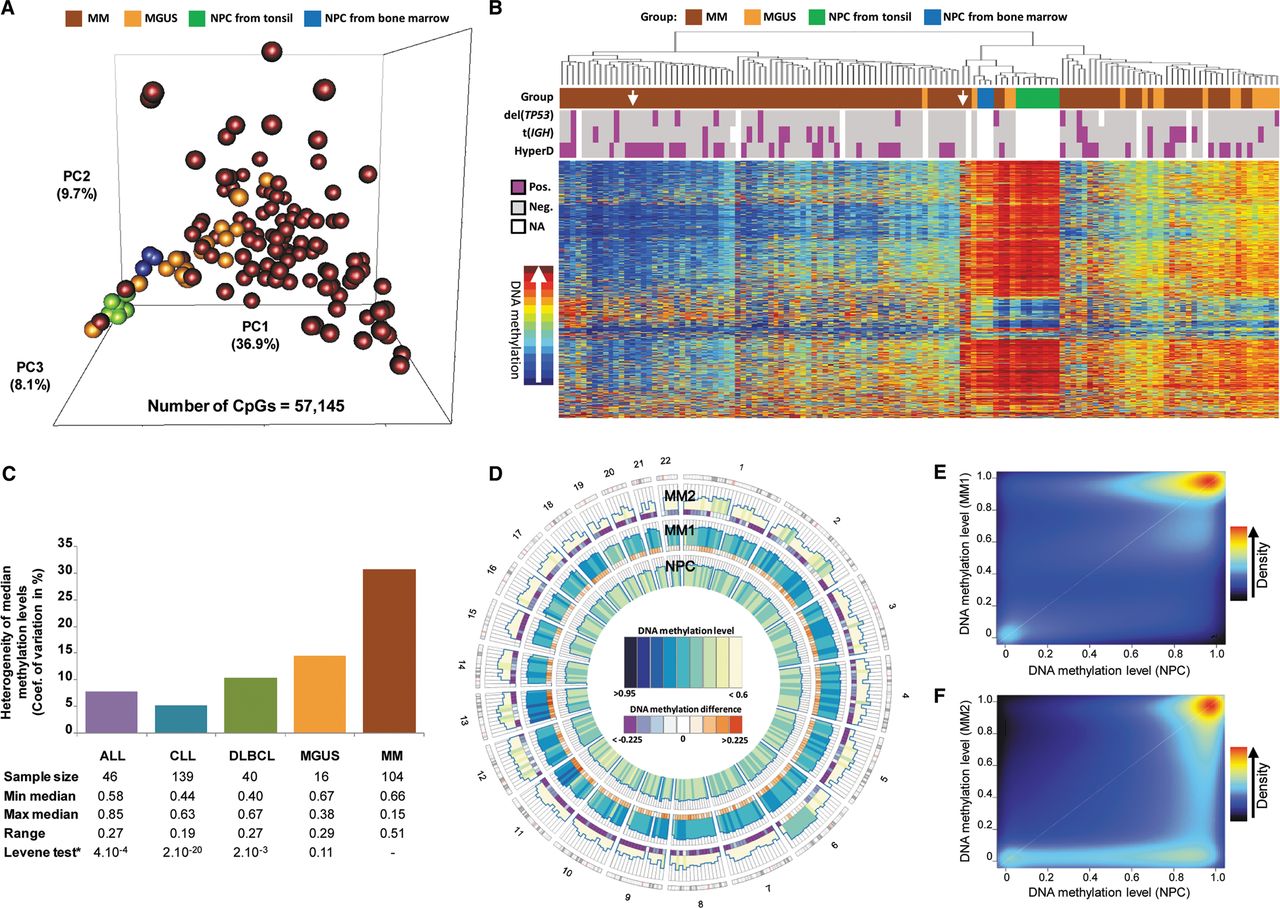
Whole-genome DNA methylation data of neoplastic and normal plasma cells. (A) Principal component analysis of HumanMethylation450 BeadChip data in MGUS, MM, and NPC from tonsils or bone marrow. (B) Unsupervised hierarchical clustering analysis of MM and MGUS patient samples as well as NPC samples from tonsil or bone marrow from healthy donors (the 20,000 CpG sites with most variable methylation values were used for this analysis). (HyperD) Hyperdiploid MM sample; [t(IGH)] MM sample with IGH translocation; [del(TP53)] MM sample with deletion of TP53. (C) Bar plot showing the coefficient of variation of median methylation values per case in ALL, CLL, DLBCL, MGUS, and MM. (D) Circular representation of DNA methylation levels of purified plasma cells of two MM patient samples (MM1 and MM2) compared to purified NPC obtained from bone marrow from healthy donors. Histograms represent CpG methylation levels averaged in 10-Mbp genomic windows. This representation with low resolution indicates that the shift of methylation levels in MM1 and MM2, as compared to NPCs, takes place throughout the genome and not only in particular chromosomal regions. (E,F) Scatter plots and density color codes for DNA methylation data of all autosomes. Pairwise comparisons of MM1 sample to NPC (E) and MM2 sample to NPC (F) are shown.


