
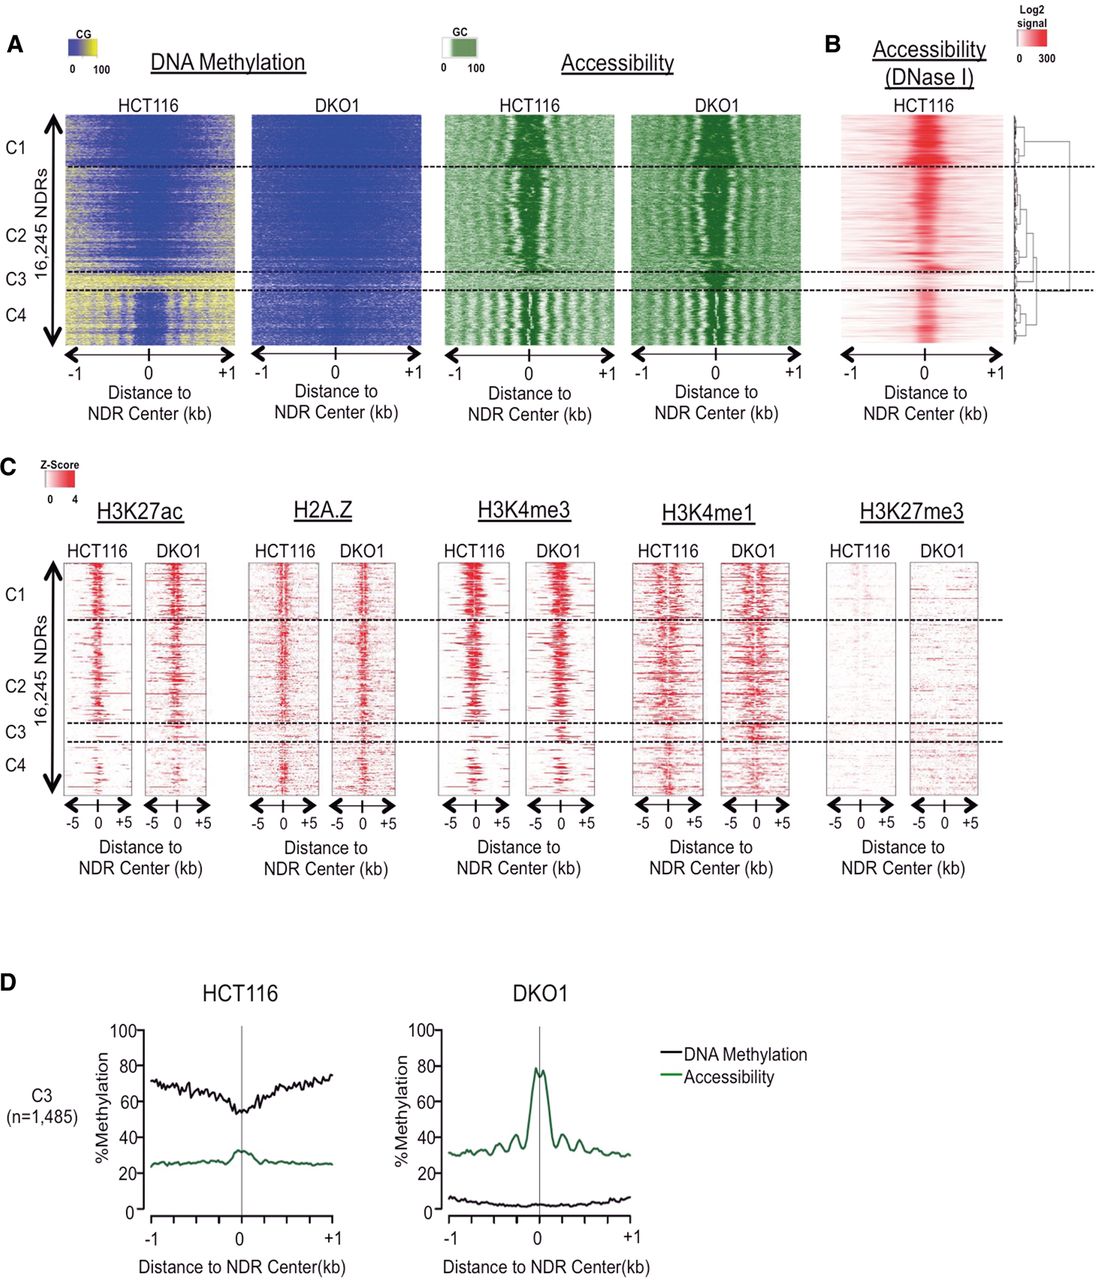
NOMe-seq detects nucleosome depletion at a subset of genomic enhancers in methyltransferase-deficient DKO1 cells. (A) Our hidden Markov model (HMM) identified all methyltransferase accessible regions (MARs), and those longer than 100 bp were considered nucleosome-depleted regions (NDRs). The heatmap includes all NDRs that were overlapping between the two biological replicates of either HCT116 and DKO1 cells (n = 16,245). NOMe-seq methylation levels (CG methylation for “DNA Methylation” and GC methylation for “Accessibility”) were aligned based on the center of the NDR and extended by ±1 kb. NDRs were hierarchically clustered based on the accessibility within ±250 bp of NDR centers in both cell types, and dashed horizontal lines separate the four top-level clusters. (B) ENCODE DNase hypersensitivity signal intensity is plotted for HCT116 cells for the same genomic regions in A. (C) Enrichment level for each histone mark was calculated as Z-score against the genomic background, and the value was plotted ±5 kb from the center of the NDRs for the same regions in A. (D) Average methylation (black) and accessibility (green) levels are shown for the altered cluster C3 (plots for the invariant clusters C1, C2, and C4 are shown in Supplemental Fig. 1D.)


