
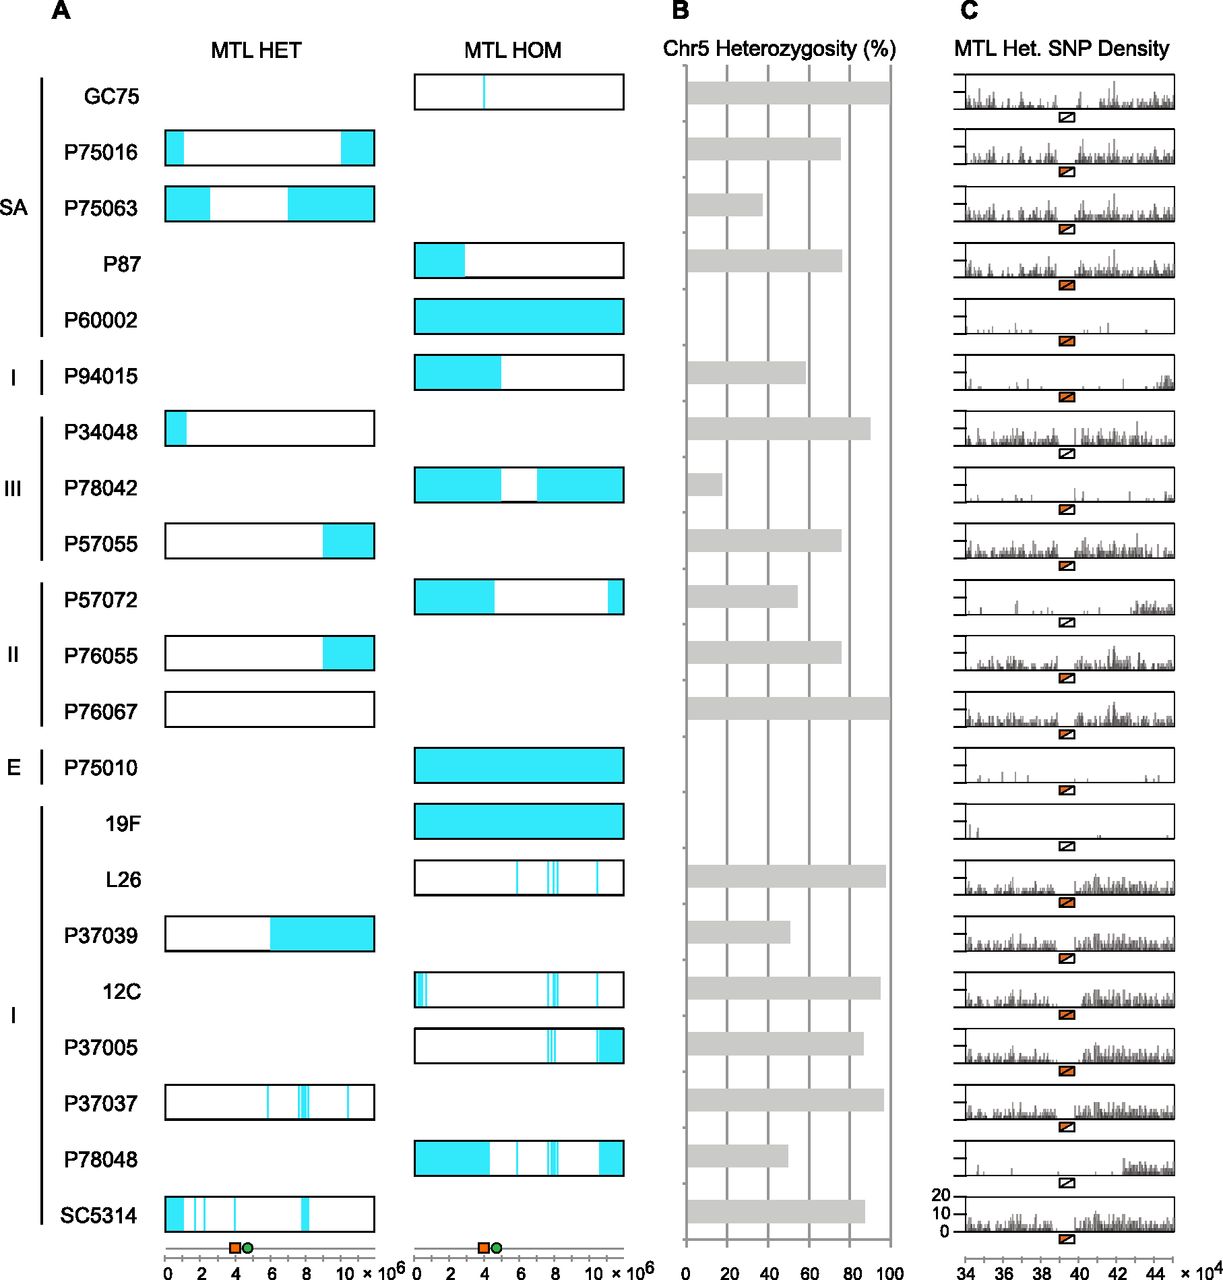
Pattern of heterozygosity on Chromosome 5 containing the MTL locus. (A) Isolates were typed as either MTL heterozygous (left column) or MTL homozygous (right column). Homozygous regions (shaded blue) of Chromosome 5 were identified from SNP data. The lower axis indicates the position of the MTL locus (orange rectangle) and centromere (green circle) on Chromosome 5, with scale shown in bases. (B) Percentage of Chromosome 5 that is heterozygous in each isolate (fraction of 5-kb windows typed as heterozygous; see Methods). (C) Pattern of SNP heterozygosity immediately flanking the MTL locus. Note that SNPs within the MTL loci were not mapped due to the high sequence divergence of the two loci. MTLa loci are marked by orange triangles and MTLα loci are marked by white triangles. Axis indicates position on Chromosome 5, with scale shown in bases.


