
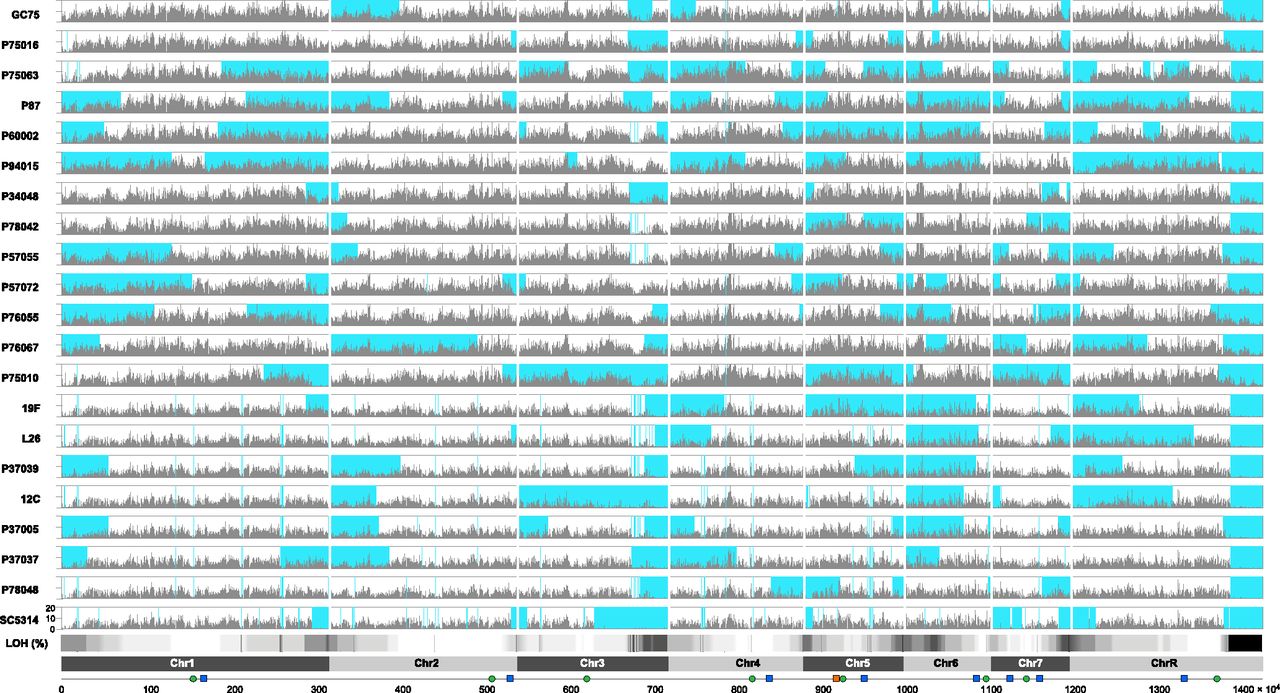
Figure 4.
Loss of heterozygosity in sequenced isolates. For each isolate, the frequency of SNPs, including both heterozygous and homozygous variants relative to SC5314, is plotted for 5-kb windows across the genome (gray bars). Homozygous regions are shaded blue; this includes regions that are homozygous and shared with the reference SC5314 and regions containing a different homozygous haplotype. Additional features shown on the chromosome plot (bottom profile) include centromeres (green circles), major repeat sequences (blue rectangles), and the MTL locus on Chromosome 5 (orange rectangle).


