
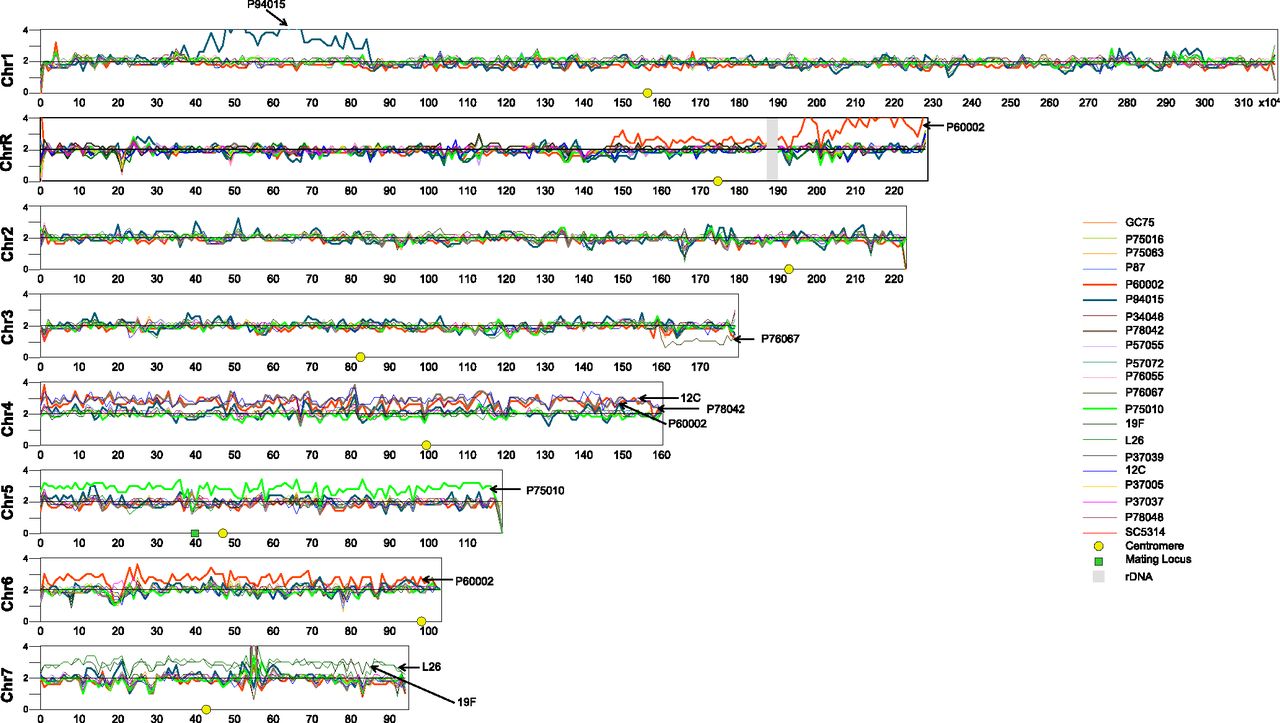
Figure 3.
Aneuploid regions of clinical isolates. For each sequenced isolate, normalized read depth in 1-kb windows is shown along each chromosome relative to the SC5314 reference. Chromosome position is shown for every 100 kb along the x-axis; average normalized depth on the y-axis is relative to diploid levels. Regions exhibiting partial or full chromosome aneuploidies are noted with the corresponding isolate name. See also Supplemental Figure S8 for chromosome copy number in each strain.


