
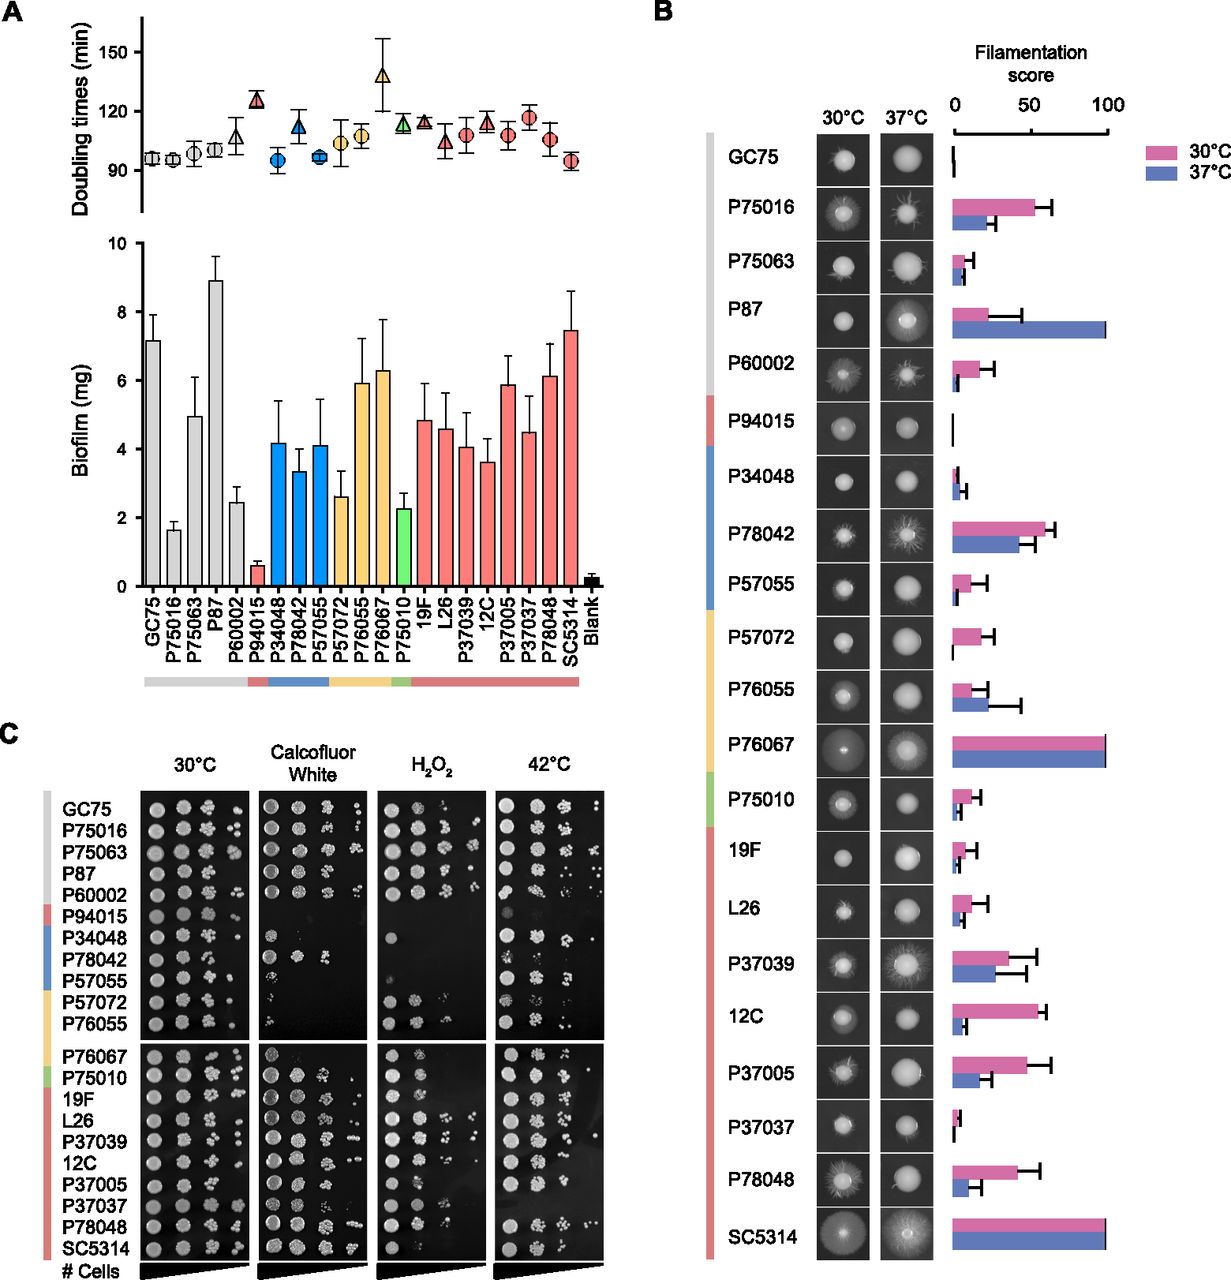
Phenotypic profiling of C. albicans isolates. (A) Doubling times and biofilm formation. Doubling times were measured in liquid YPD medium at 30°C. Circles represent euploid isolates and triangles represent aneuploid isolates. Biofilm dryweight biomasses ± standard error. Colors represent clade designation as follows: (SA) gray; (I) red; (II) yellow; (III) blue; (E) green. (B) Filamentation of clinical isolates grown on Spider medium for 7 d at 30°C or 37°C. Bar graphs represent filamentation scores ± standard error for strains at 30°C (pink) or 37°C (blue). (C) Assays of clinical isolates grown in the presence of stressors. Tenfold dilutions of cells were plated under regular growth conditions (SCD, 30°C), cell wall stress (SCD + 100 µg/mL calcofluor white, 30°C), oxidative stress (SCD + 2 mM hydrogen peroxide, 30°C), and thermal stress (SCD medium, 42°C).


