
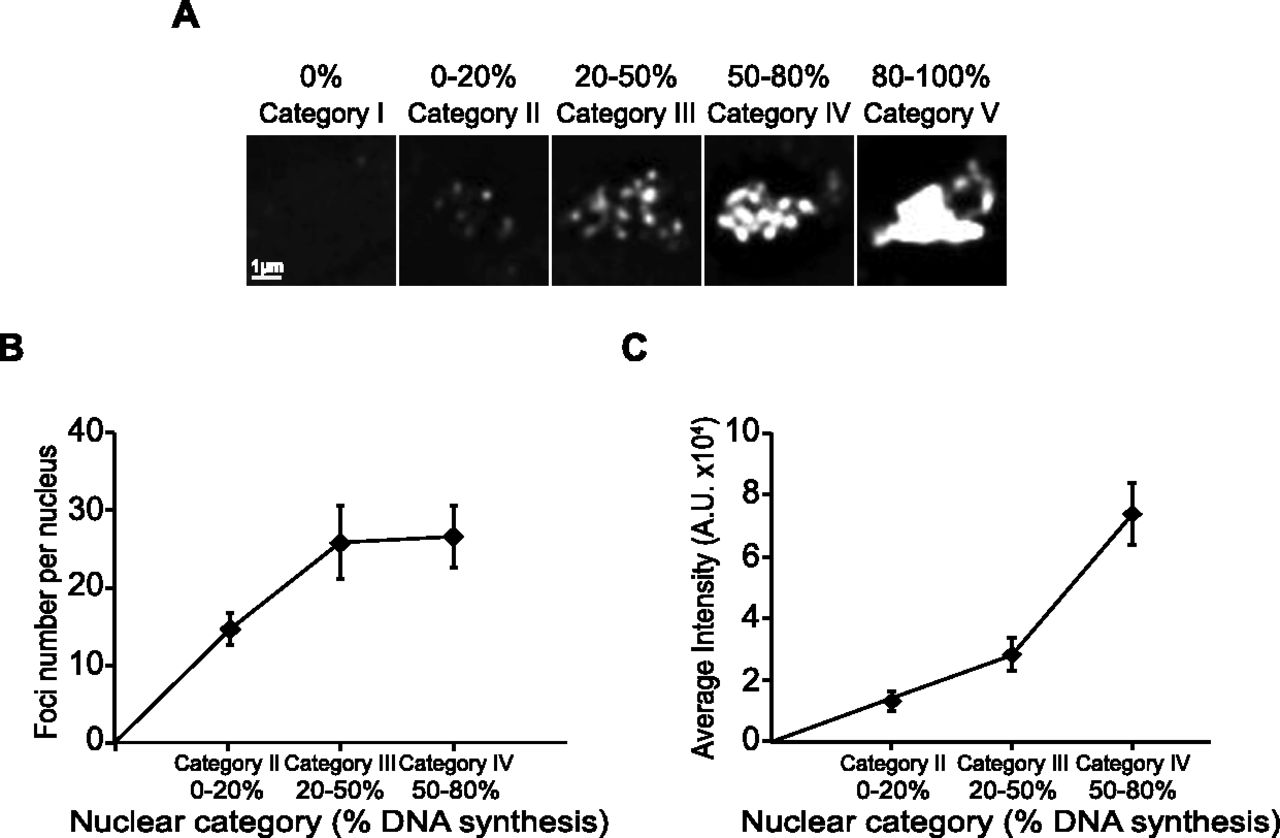
Characterization of replication foci during progression through S-phase. A synchronous cell culture was continuously labeled with 2 µM BrdU, and samples were taken at 10-min intervals starting just before the onset of S-phase and extending into G2. The sites with ongoing DNA synthesis were detected using immunofluorescence. (A) Five different categories of nuclei were created according to the percentage of replicated DNA: nuclei without detectable DNA synthesis (0%), nuclei replicated 0%–20%, 20%–50%, 50%–80%, and 80%–100% corresponding to categories I, II, III, IV, and V, respectively. (B) Replication foci number was scored for nuclei replicated from 0%–20%, 20%–50%, and 50%–80%. Foci number increased from 14 on average for nuclei replicated from 0%–20% to 26 on average for nuclei replicated from 20%–50%. For 50%–80% replicated nuclei, there are 27 foci on average, but replication foci appear more intense. Data are represented as mean values ± SD (n = 20). (C) Replication foci intensity increases throughout S-phase. The foci intensity increases 2.2-fold from nuclei 0%–20% replicated to nuclei 20%–50% replicated and an additional 2.6-fold to nuclei 50%–80% replicated. Data are represented as mean values ± SD (n = 20).


