
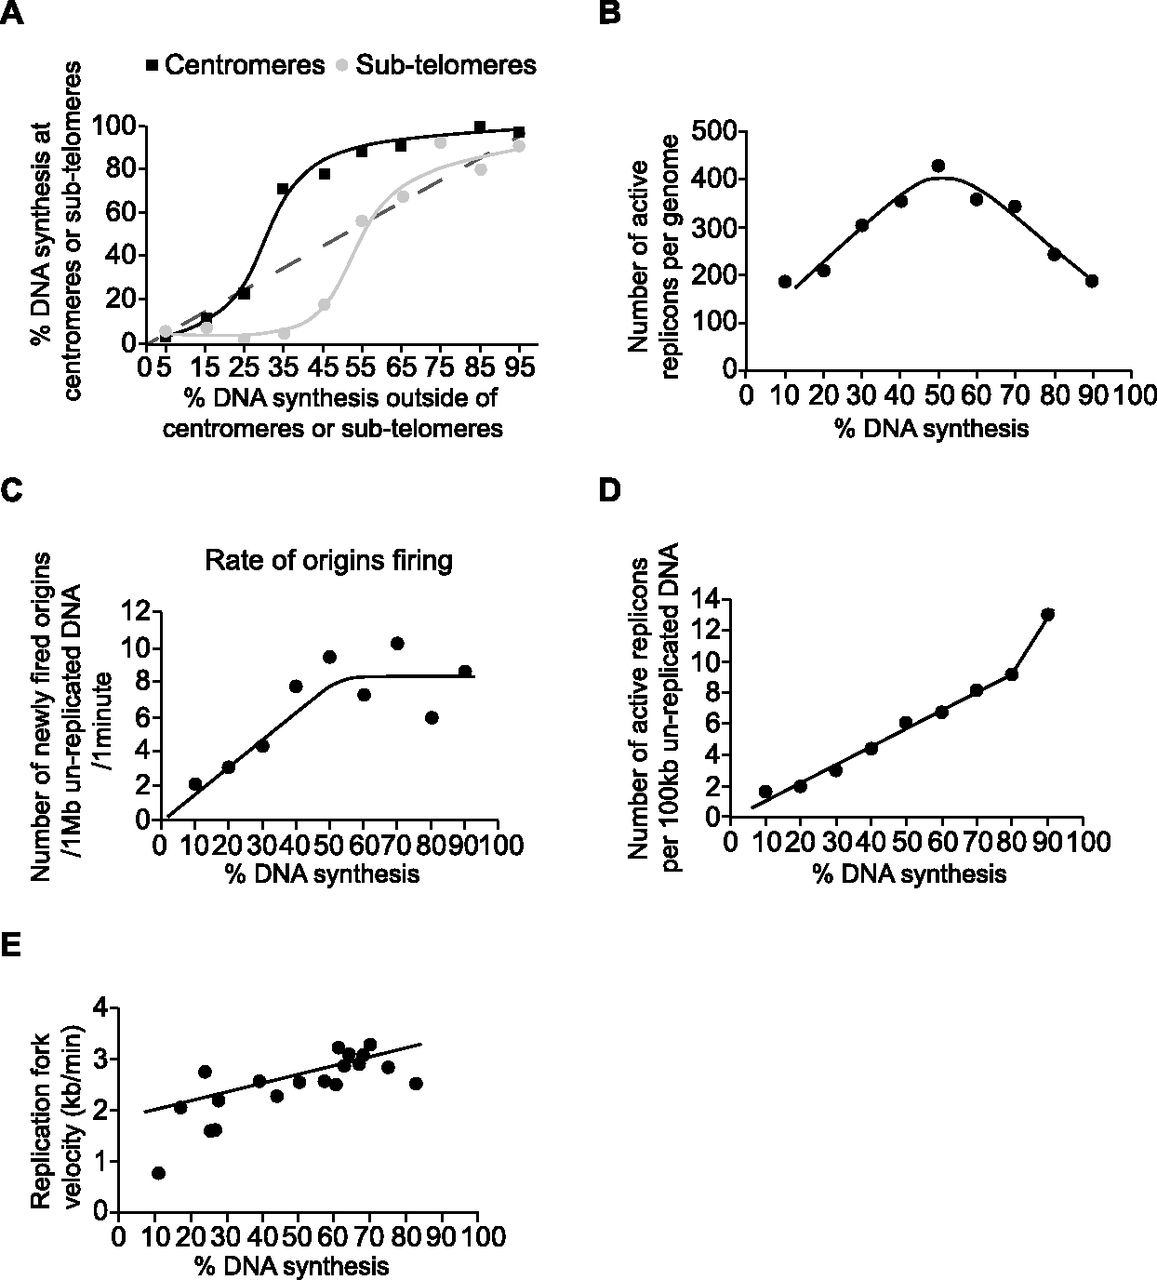
Origin firing throughout S-phase. (A) Centromeric and subtelomeric regions were identified on single DNA molecules relative to hybridized FISH probes in their vicinity. The extent of DNA synthesis for centromeres 1 and 3 and for subtelomeres on Chromosomes I and II are plotted as a function of the extent of DNA synthesis measured for the rest of each single DNA molecule. (B) The number of active replicons per genome was determined by analyzing pulse-/chase-labeled DNA molecules and is plotted as a function of the percentage of DNA synthesis on each molecule. (C) The number of newly fired origins during the 3-min chase with EdU is plotted as a function of the percentage of DNA synthesis for that DNA molecule. The rate of origin firing is expressed per minute per Mb of unreplicated DNA. (D) The number of active replicons per 100 kb of unreplicated DNA was determined from pulse-/chase-labeled DNA molecules and is plotted as a function of the percentage of DNA synthesis for each molecule. (E) The average replication fork velocity measured for each single DNA molecule is plotted as a function of the percentage of DNA synthesis on each molecule. For A–E, data points are represented as mean values.


