
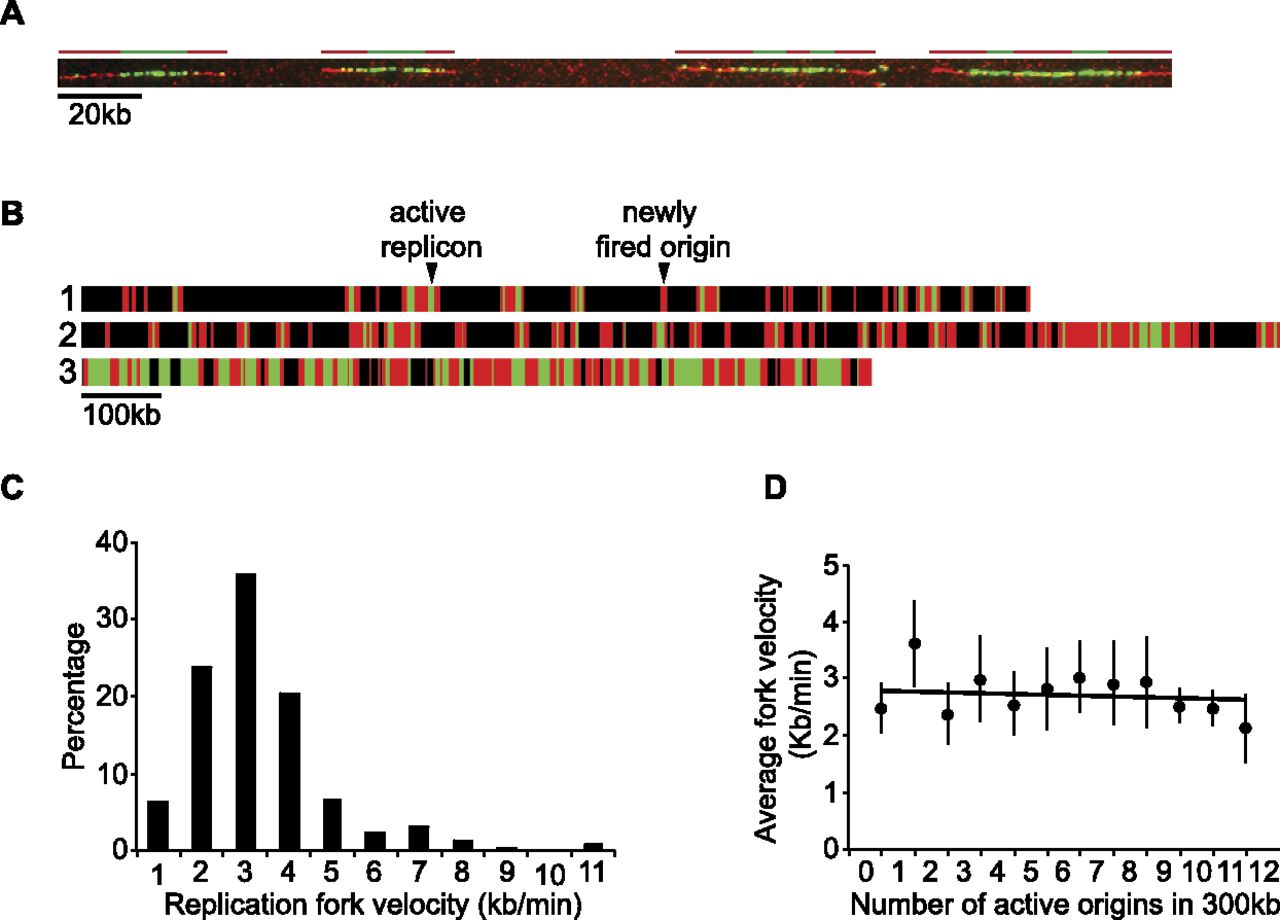
Fork velocities throughout S-phase. (A) Representative DNA molecule with six replicons. Green (BrdU pulse) and red (EdU chase) lines drawn on top of the molecules represent the position of six replicons. We measured the length of the red tracks immediately adjacent to green tracks that were flanked by unreplicated segments (progressive forks) and used the duration of the chase (3 min) to derive replication fork velocities. (B) Three representative single DNA molecules chosen from the population of molecules. Black bars represent unreplicated DNA, green bars represent the length and position of BrdU incorporation (pulse), and red bars represent the length and position of EdU incorporation (chase). An active replicon results from an origin fired during the BrdU pulse, which replication forks continue to incorporate during the EdU chase, and where at least one fork is flanked by an unreplicated segment at the end of the chase. A newly fired origin is an origin fired during the 3-min EdU chase (exclusively red tracks). (C) Histogram showing the distribution of 355 replication fork velocities. The average fork velocity is 2.8 kb/min. (D) The number of fired origins and the corresponding fork velocities were scored in consecutive 300-kb windows along single DNA molecules. Data points are represented as mean values ± SD.


