
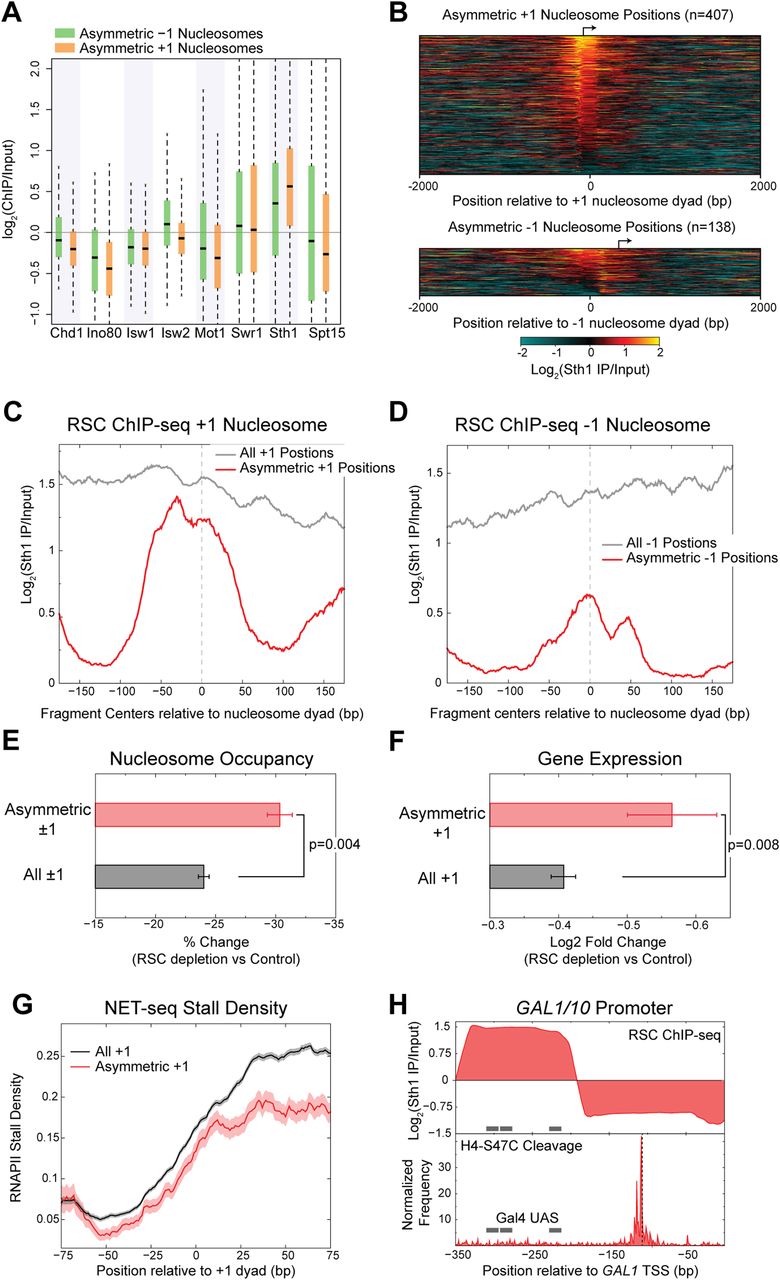
Asymmetric nucleosomes are stabilized by RSC. (A) ChIP enrichment of chromatin remodelers and Spt15 over the dyad axis ±70 bp of asymmetric +1 and −1 nucleosome positions is shown as box-plots. (B) Heatmap of the log2 enrichment of the RSC catalytic subunit, Sth1 over input, plotted relative to the dyad axis of asymmetric +1 nucleosome positions (top) and asymmetric −1 nucleosome positions (bottom). (C) ChIP-seq of the RSC catalytic subunit, Sth1, shows enrichment of RSC specifically over the nucleosome at asymmetric +1 positions compared to enrichment at the upstream NDR for all +1 positions. Log enrichment of the normalized density of fragment centers is plotted. The fragment centers were obtained from paired-end sequencing data and correspond to fragments of length 200 ± 20 bp. Data are averaged over a 20-bp moving window. (D) Same as C for asymmetric −1 nucleosome positions. (E) Depletion of the RSC component Sth1 results in a significantly greater decrease in nucleosome occupancy at asymmetric ±1 positions compared to all ±1 positions. P = 0.004 (Kolmogorov-Smirnov test). (F) Depletion of the RSC component Sth1 results in a significantly greater decrease in the expression of well-expressed genes with asymmetric +1 nucleosome position compared to all well-expressed genes with a +1 nucleosome position. P = 0.008 (Kolmogorov-Smirnov test). For E and F, mean and SEM are plotted. (G) Well-expressed genes with asymmetric +1 nucleosome positions feature decreased stalling by RNA polymerase II at the +1 nucleosome compared to well-expressed genes with a +1 nucleosome position. (H) (Top) Plot showing the log2 enrichment of Sth1 ChIP-seq at the GAL1/10 promoter, for fragment lengths between 120 and 160 bp, with the Gal4 binding sites indicated with gray bars. (Bottom) H4-S47C cleavage frequency is plotted for the GAL1/10 promoter, showing a highly asymmetric nucleosome position downstream from the Gal4 binding sites. The dyad position of the asymmetric nucleosome is indicated with a dashed black line, showing that the frequency of cleavages is higher upstream of the dyad.


